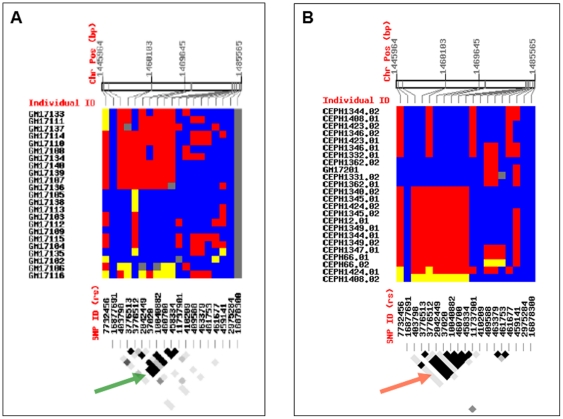
Figure 5. Haplotype structure of the SLC6A3 3′UTR locus in African-American- and Caucasian- populations.
Graphical representation of the haplotype structure of the 3′-UTR region: African-American population - Panel A, top; Caucasian population - Panel B, top. Color scheme: blue – homozygotes, common allele, yellow – homozygotes, rare allele, red – heterozygotes, and grey – undetermined. Data are retrieved using Genome Variation Server (http://gvs.gs.washington.edu/GVS). Bottom of the panels illustrates corresponding haplotype maps: Confidence Bounds Color scheme: Strong evidence of LD – dark grey, uninformative- light grey and white color indicates strong evidence of recombination. More of dark grey in CE (red arrow) is indicative of the presence of LD block which is population-specific, whereas the light grey and the white color are predominant in the haplotype map of AA population (green arrow), indicate high recombination rate.

