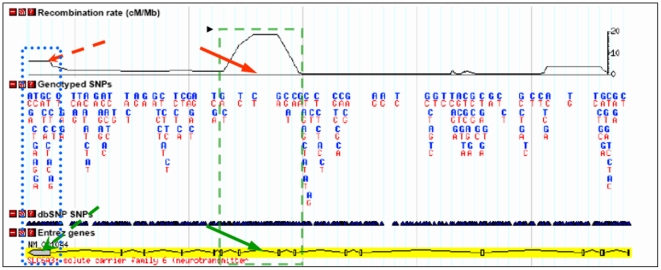
Figure 6. Increased recombination rate in the VNTR-encompassing regions of the SLC6A3 locus.
Both VNTR regions are within the recombination Hotspots indicated by red arrows (HapMap Data Release 27 PhaseII+III, Feb09, on NCBI B36 assembly). The green slashed box encloses a recombination hot spot (upper panel) that is projected to the intron8 (green arrow, bottom panel); the blue dotted box encloses a recombination hot spot (upper panel) mapped to the 3′UTR – region (green arrow).

