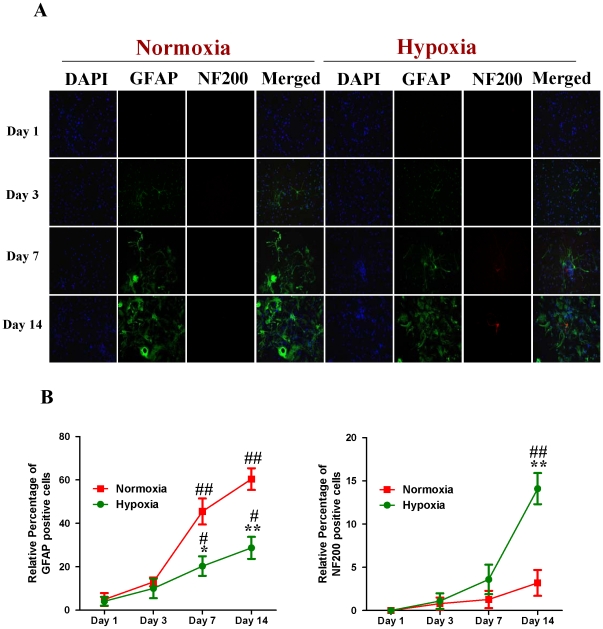
Figure 4. Neuronal and astroglial differentiation of NPCs under normoxic and hypoxia-reoxygenation conditions.
For HR treatment, NPCs were exposed 1% to O2 for 24 h and then switched to 21% O2 for 1, 3, 7, and 14 days, while for normoxic treatment, NPCs were consistently cultured under normoxia with 21% O2. Neuronal differentiation was identified by using NF200 whereas glial differentiation was observed by detecting GFAP expression. The fluorescent images were obtained with Carl Zeiss Axio Observer Z1 fluorescent imaging system. A. Representative immunofluorescent imaging of Neurofilament 200 (NF 200) and glial fibrillary acidic protein (GFAP) in NPCs. Red color: NF200 staining; Green color: GFAP staining. Nuclear localizations of NF200 and GFAP were verified by co-localization with DAPI staining (blue color). B. Statistical analysis on the relative percentage of GFAP and NF200 positive cells in NPCs (Mean ± S.D., n = 6). Hypoxia versus normoxia at same time points, * p<0.05, ** p<0.01; Observed day versus day 1 under the same oxygen condition, # p<0.05, ## p<0.01.

