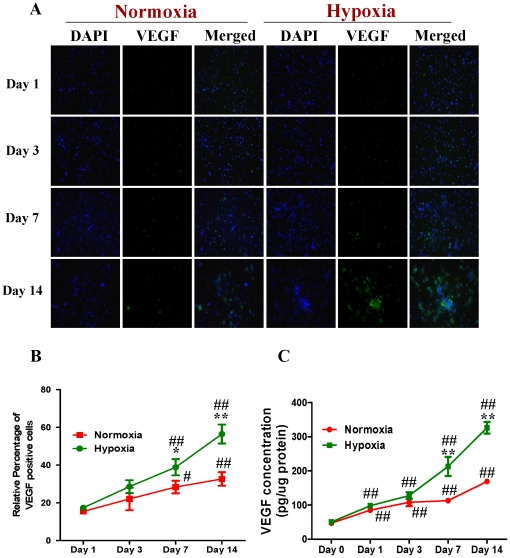
Figure 8. Expression of VEGF in NPCs treated with normoxia and hypoxia-reoxygenation.
For HR treatment, NPCs were exposed 1% to O2 for 24 h and then switched to 21% O2 for 1, 3, 7, and 14 days, while for normoxic treatment, NPCs consistently cultured under normoxia with 21% O2. A. Representative immunofluorescent imaging of VEGF expression in NPCs: Green color: VEGF staining. Nuclear localization of VEGF was verified by co-localization with DAPI staining (blue color). B. Statistical analysis on the relative percentage of VEGF positive cells in NPCs (Mean ± S.D., n = 6). Hypoxia versus normoxia at same time points, * p<0.05, ** p<0.01; Observed day versus day 1 under the same oxygenation condition, # p<0.05, ## p<0.01. C. ELISA detection of VEGF concentrations in culture media from normoxic and hypoxic NPCs. Cell culture supernatants were collected from the normoxic and hypoxic NPCs at 0, 1, 3, 7 and 14 days. VEGF was detected with ELISA immunoassay kit (R&D systems) according to manufacturer's protocol (Mean ± S.D., n = 3). Hypoxia versus normoxia at same time points, ** p<0.01; Observed day versus day 0 under the same oxygenation condition, ## p<0.01. Each sample was measured in duplicate.

