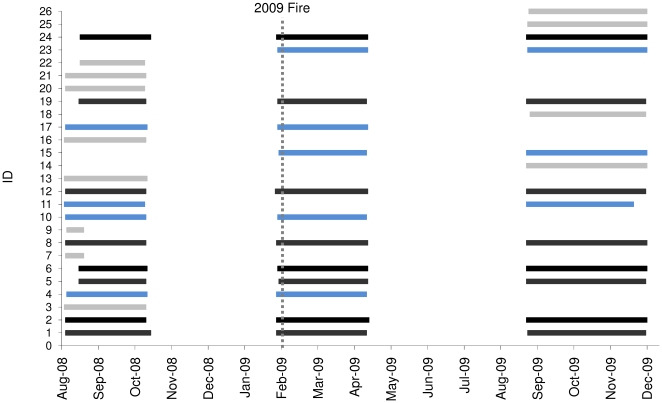
Figure 3. The duration over which each study animal was fitted with a proximity-logging radiotransmitter.
Black bars represent individuals carrying transmitters for all three study periods, blue bars represent individuals carrying transmitters for two of the three periods and light grey bars represent individuals carrying transmitters for one study period. The vertical line shows the date that the Black Saturday wildfires commenced (7 February 2009). The collars fitted to animals in February 2009 were attached over the four days immediately preceding the fires. Individuals 1–6 were located in the unburnt section of the study site and individuals 7 to 26 were located in the burnt area of the study site (see Figure 2 for map).

