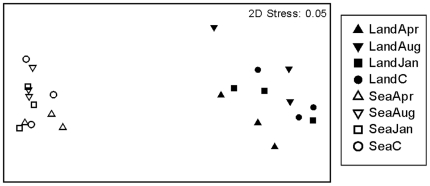
Figure 4. Two-dimensional plots of principal coordinate axes (metric multi-dimensional scaling, MDS).
The MDS shows ordination of centroids of assemblages at the landward and seaward sides of each of 3 breakwaters for each time of disturbance (D1 = April 2003, D2 = August 2003, D3 = January 2004, C = unmanipulated plots). Analyses were based on Bray-Curtis dissimilarities after 4th-root transformation of data collected in May 2004. A Stress value of 0.05 indicates that the ordination is excellent and that the interpretation of patterns in 2 dimensions is highly reliable.

