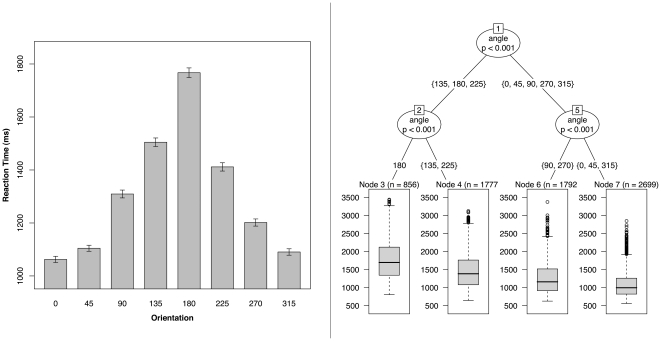
Figure 3. Mean response time by stimulus orientation.
(Left panel) Mean response time, calculated across 5 of the 6 postures, plotted as a function of stimulus hand orientation. Error bars show ±1 S.E.M. (Right panel) Classification tree of response time showing a primary split between egocentric (0°, 45°, 90°, 270°, 315°) and allocentric (135°, 180°, 225°) views of the hands.

