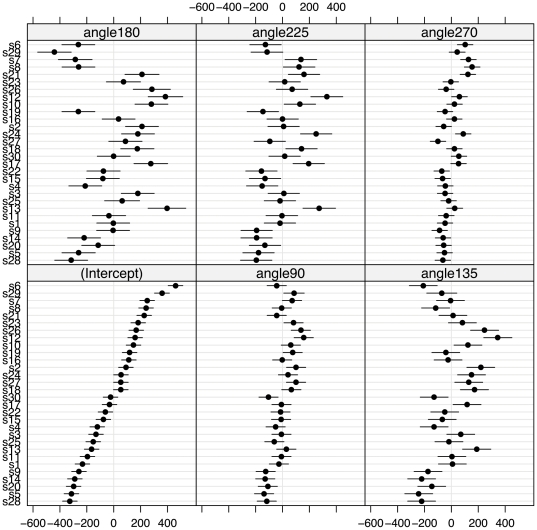
Figure 4. Random effects for response time.
Caterpillar plots demonstrating the variability in participants' response times about the fixed effects. In each of the six plots, the thirty participants (labelled s1 to s30 by alphabetical order of their surnames) are ordered, from fastest to slowest, by their response times in the baseline condition (combined 0°, 45°, 315°) or ‘intercept’. The plots show strong correlation between performance in the baseline and the other egocentric orientations (90°, 270°) and weaker correlation between baseline performance and the allocentric orientations (135°, 180°, 225°).

