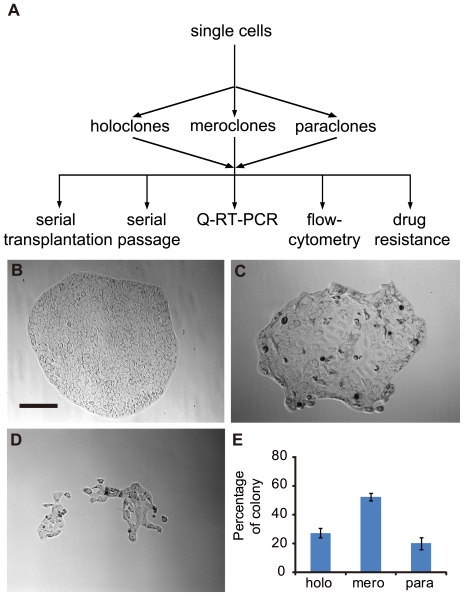
Figure 1. Colony heterogeneity in pancreatic cancer cell line BxPC3.
(A) Schematic depicting the procedure of deriving BxPC3 cell clonal cultures and functional assays. Lower panels show representative holoclones (B), meroclones (C) and paraclones (D) from BxPC3 cultures. All photographs were taken at 2 weeks after plating (Bar, 100 microns). At this time point, each type of colonies was counted (E). The results from repeated experiments (n = 4) are presented as means± s.e.m in histogram.

