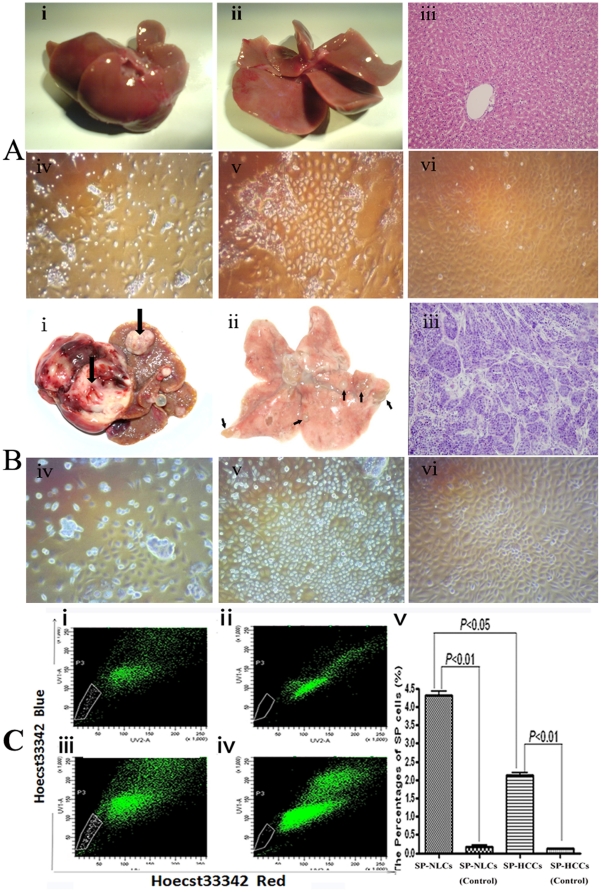
Figure 1. Upper panel: normal liver segregation and cell culture.
(A-i) Morphology of livers in the non-DEN treated group, (A-ii) Thin-sliced sections reveal completely normal liver tissue, (A-iii) Histological features of normal liver with a regular structure. Primary cultured NLCs for (A-iv) 4 days, (A-v) 15 days and (A-vi) 25 days. Middle panel: primary HCC tissue segregation and cell culture. (B-i) Multiple primary HCC nodules in the rat liver, one of which is indicated by an arrow, (B-ii) Metastatic HCC nodules in rat lungs, which are indicated by arrows, (B-iii) Histological features of metastatic HCC tissue, in which normal lung lobules were replaced by carcinoma masses; Primary cultured HCC cells for (B-iv) 4 days, (B-v) 15 days and (B-vi) 30 days. Lower panel: the isolation of different subpopulations. (C-i) Without verapamil: SP cells were shown as a percentage of the NLCs; (C-ii) With verapamil: the profile of SP cells decreased greatly. (C-iii) Without verapamil: SP cells were shown with low fluorescence in HCCs; (C-iv) With verapamil: fluorescence of the SP cells fraction shifted to a higher level. (C-v) The percentages of SP cells in different groups are reflected in a column chart. Original magnification, 200× (A, B-iii), 100× (A, B-iv, v, vi).

