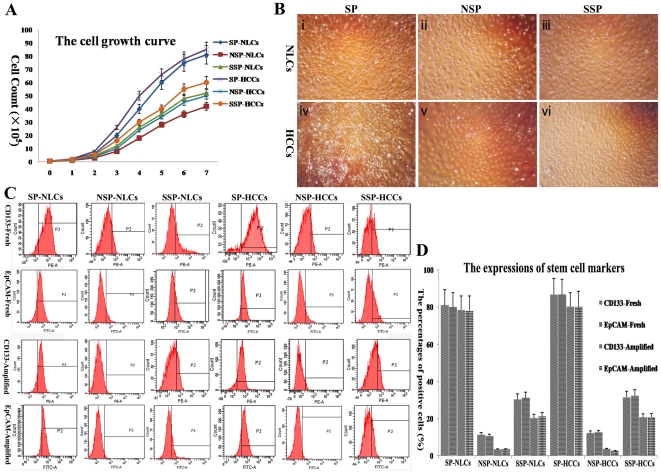
Figure 2. The self-renewal analysis of each subpopulation.
(A) The cell growth curve during 7 days culture. (B) After amplification, distinct cell densities were observed in the different subpopulations. (C) The expression of stem cell markers (CD133 and EpCAM) was different in each freshly isolated and amplified subpopulation by FACS. (D) The exact data were reflected by a column chart. CD133/EpCAM-Fresh indicates the expression of CD133/EpCAM in freshly isolated subpopulations, and CD133/EpCAM-Amplified means the expression of CD133/EpCAM in amplified subpopulations. Original magnification, 100× (B).

