
Fig. 7.
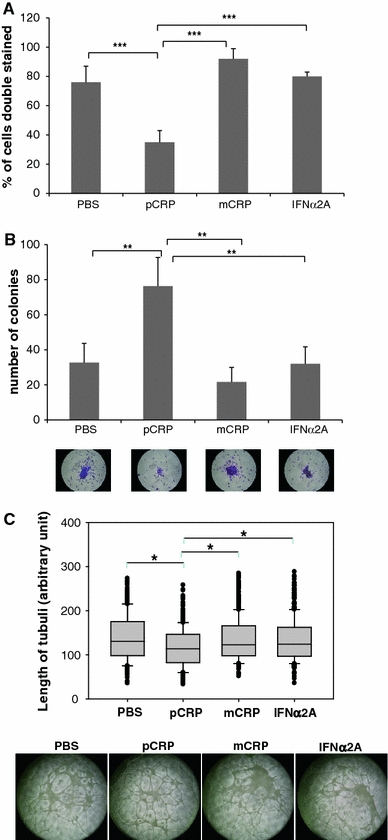
The effect of mCRP (1 mg/ml), pCRP (5 mg/ml) or IFNa2A (1 ng/ml) on phenotype and function of EPCs. a Binding of ulex lectin and uptake of acetylated LDL after 72 h of culture of EPCs in the presence or absence of pCRP, mCRP and IFNa2A. The bar graph shows the percentage of cells double positive for binding of ulex lectin and uptake of acetylated LDL as compared to the total number of cells in three random optical fields (20× magnification). Mean and SD of n = 3. The statistical significance was determined by one-way ANOVA with Tukey’s post hoc test, ***p<0.001. b The bar graph shows the number of colony forming units (CFU-Hills) visualised by Giemsa staining, formed by EPCs that had been cultured in the presence of pCRP, mCRP or IFNalpha2 for 72 h (mean and SD of three individual donors, n = 3). The statistical significance was determined by one-way ANOVA with Tukey’s post hoc test, **p < 0.01. c The boxplot shows the lengths of the tubuli formed in a co-culture of HUVECs and EPCs (n = 3) in an endothelial tube formation assay. The EPCs had been cultured in the presence of pCRP, mCRP or IFNa2A for 72 h prior to the assay. The photomicrographs were taken when a clear tubuli network was observed after 16 h of incubation. The statistical significance was determined by ANOVA on ranks with Dunn’s post hoc test, *p < 0.05