Figure 8.

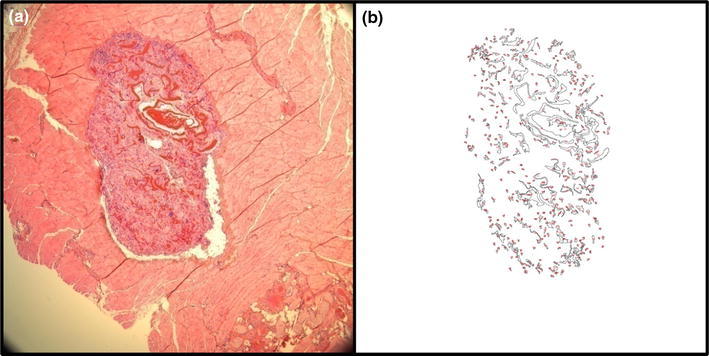
The degradation of SFCS scaffold was quantified using image processing in Image J software. An example of the (a) original H&E image and (b) the image after processing shows the area covered by non-degraded scaffold

The degradation of SFCS scaffold was quantified using image processing in Image J software. An example of the (a) original H&E image and (b) the image after processing shows the area covered by non-degraded scaffold