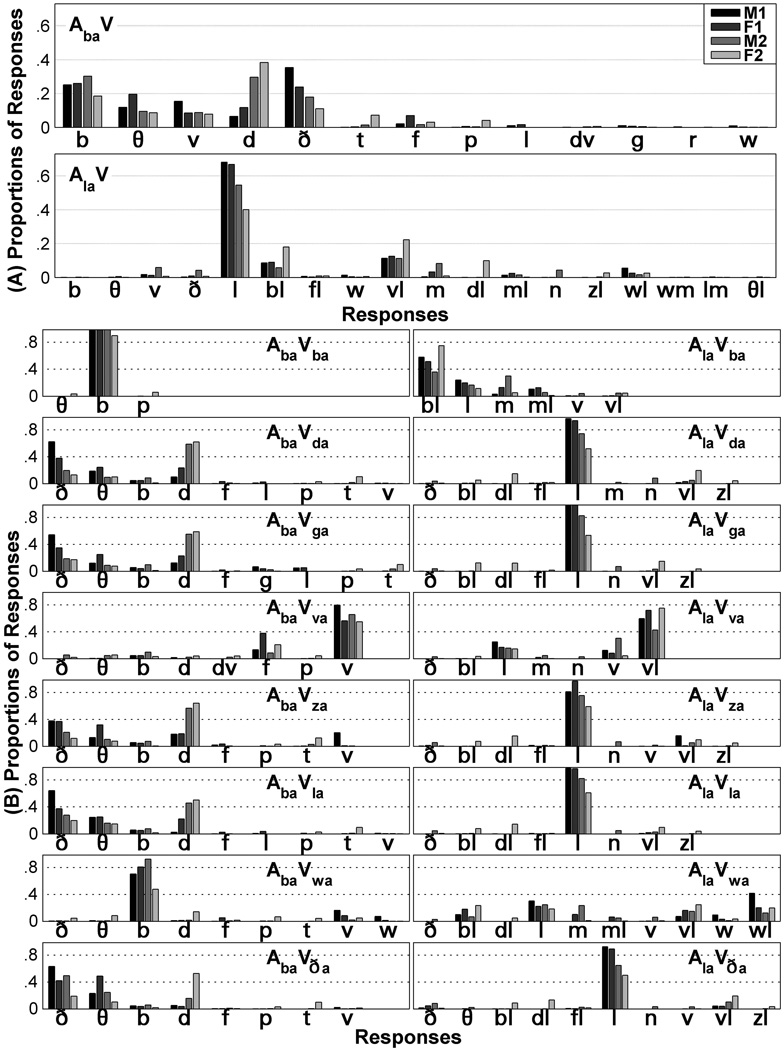
Figure 3.
Proportions of open-set consonant identifications. Proportions in Part A pool across video stimuli for the four talkers (M1, F1, M2, and F2), and proportions in Part B pool across tokens within each audiovisual stimulus type for the four talkers. The top of Part A shows response proportions to AbAV, and the bottom of Part A shows response proportions to AlAV. The infrequent (fewer than 10) responses are not shown. The bars account for 99.6% of AbAV and 99.7% of AlAV responses. In Part B, consonant identification response proportions omit infrequent responses.

