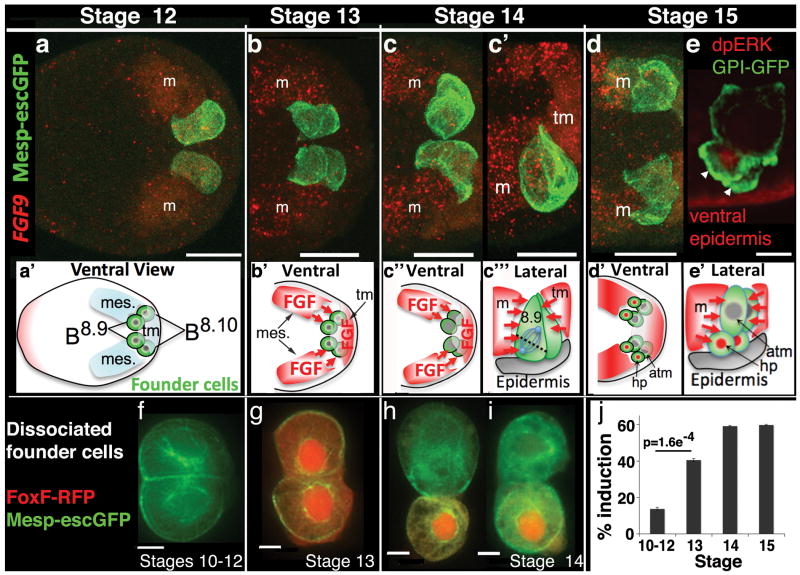
Figure 1. Nature and timing of heart progenitor lineage induction.
(a-d) Ventral and lateral (c′) optical sections of FGF9 in situ hybridizations (m = mesenchyme, tm = tail muscle, scale bar = 30μm). (e) In vivo dpERK antibody staining indicates differential MAPK activation in the smaller heart progenitor cells (arrowheads) shortly after founder cell division, lateral view, scale bar = 10μm. (a′-e′) Below each image is a diagram illustrating the spatial relationship between founder cells (B8.9 and 8.10) and FGF9 expressing cells, (hp = heart progenitor, atm = larger sister cell lineage, mes. or m = mesenchyme). (f-i) Representative founder cell clone pairs resulting from staged dissociations, scale bar = 5μm. (j) Percent induction (FoxF-RFP positive cells) produced by founder cells isolated at discrete stages, n=1117 for St. 10-12, n=658 for St. 13, n=651 for St. 14 and n=693 for St. 15. Embryos are displayed anterior to the left in these and all subsequent figures.

