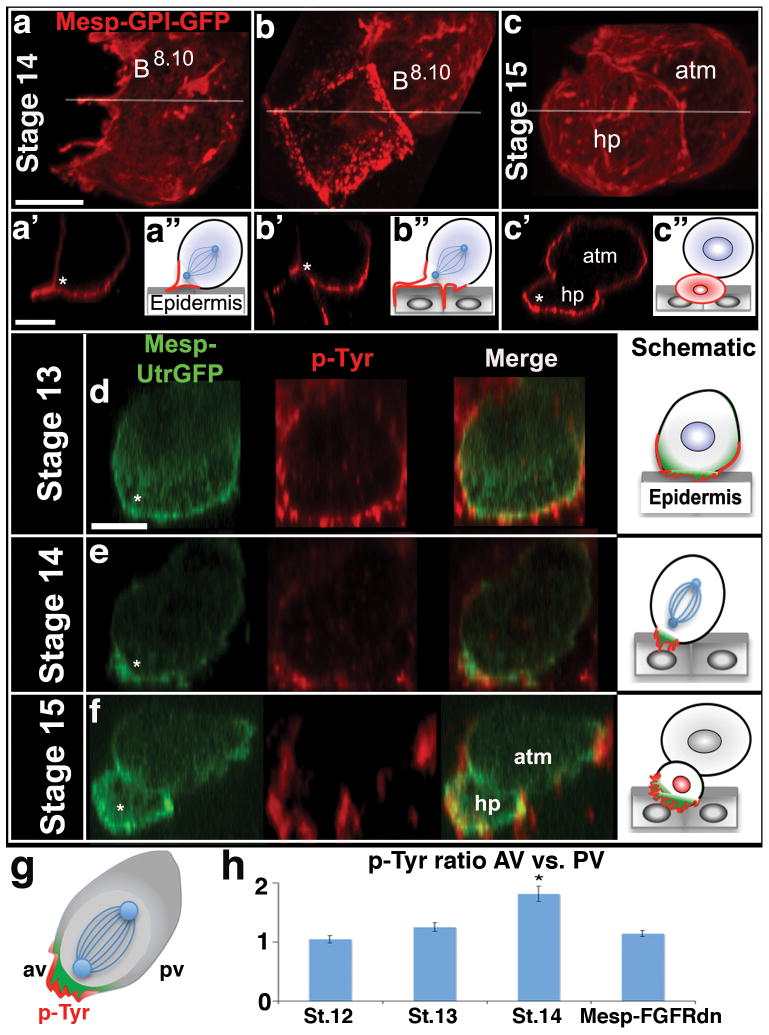
Figure 2. Localized protrusive activity correlates with localized induction.
(a-c) Ventral projections of membrane anchored-GFP (GPI-GFP) labeled founder lineage cells, Stage 14-15. (a′-c′) Lateral optical sections through corresponding stacks at the position indicated in (a-c) by white lines. (a″-c″) Diagrams illustrating invasion of underlying ventral epidermis. (d-f) Representative, lateral optical sections through staged B8.9 founder cells (d,e) and their progeny (f), green = Utr-GFP and red = pTyr for both images and accompanying schematics. Asterisks indicate the anterior-ventral position at which heart progenitor cells (hp) consistently emerge, atm = anterior tail muscle lineage. (g) Schematic of a dividing founder cell (after Fig. 2e) illustrating method for comparing p-Tyr levels between the anterior-ventral (av) and posterior-ventral (pv) membranes. (h) Quantitative analysis of membrane pTyr ratios (AV vs. PV). Note that significant pTyr polarization (asterisk) was first observed at stage 14 (St. 12 p=0.64, n=92; St. 13 p=0.21, n=89; St. 14 p=9.3E-012, n=89) and that this polarization was dependent on FGF signaling (St. 14 Mesp-FGFRdn p=0.103, n=57). Scale bars = 10μm.

