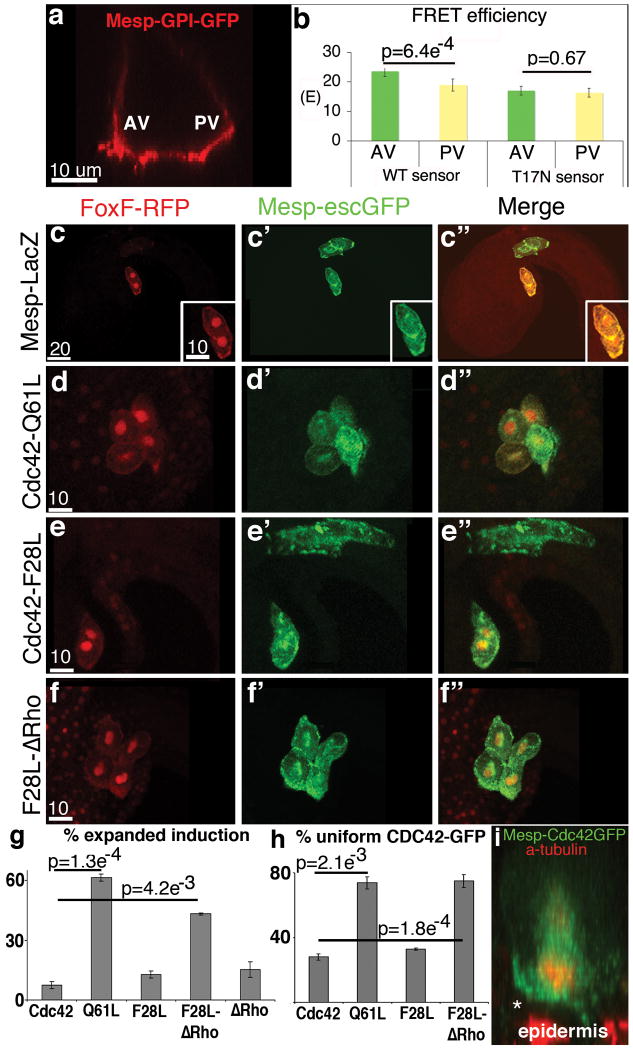
Figure 3. Localized CDC42 activity is required for differential induction.
(a) Lateral optical section of a stage 14 GPI-GFP labeled founder cell illustrating the anterior-ventral (AV) and posterior-ventral (PV) regions used to generate FRET data. (b) FRET data, n=30 for WT sensor and n=26 for T17N, the inactive T17N probe serves as a negative control. (c-f) Representative results from induction assays, fluorescent reporters and transgenic backgrounds as indicated above and to the left respectively. Red channel in (c″) was amplified to better visualize the embryo. (g-h) Quantitative data showing % of transgenic embryos displaying; (g) loss of localized induction, n=375 for Cdc42, n=466 for Q61L, n=461 for F28L, n=240 for F28L-ΔRho, and n= 250 for ΔRho and; (h) loss of polarized CDC42-GFP enrichment along the heart progenitor/ventral membrane, n=31 for Cdc42. n=31 for Q61L, n=25 for F28L, n=30 for F28L-ΔRho. (i) Lateral projection of dividing founder cell displaying enrichment of CDC42-GFP (green) along the presumptive heart progenitor membrane (asterisk). Scale bars in um as indicated.

