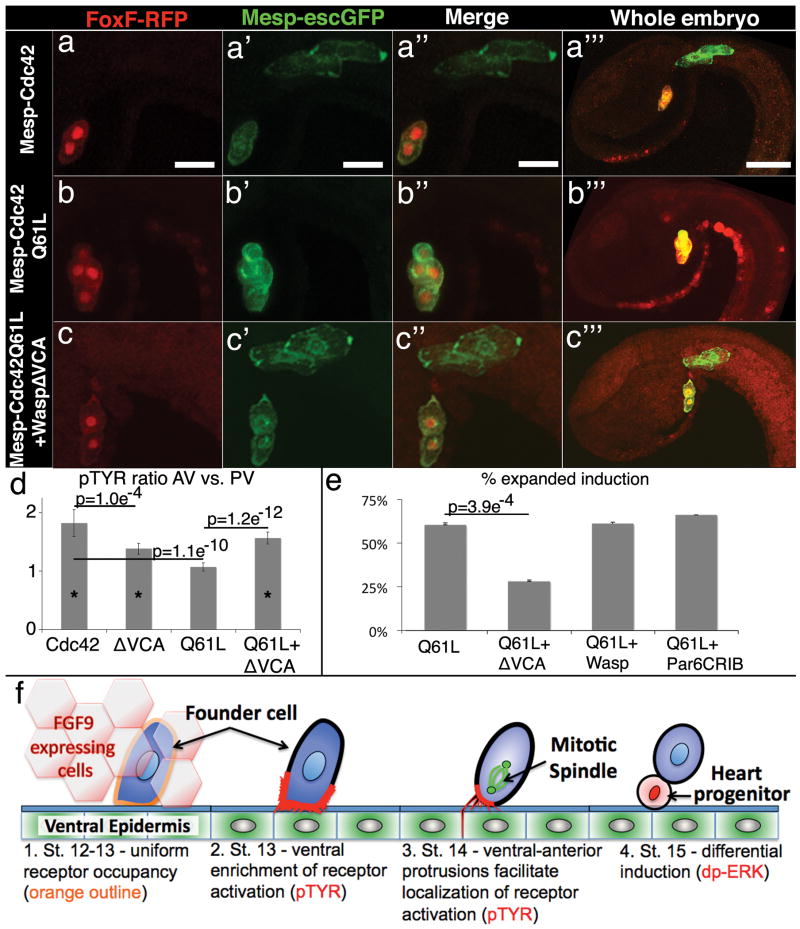
Figure 4. Cytoskeletal polarity directs differential induction.
(a-c) Representative results from induction assays, reporters and transgenic backgrounds as indicated above and to the left respectively, scale bar = 20μm, in (a′″-c′″) the red channel has been amplified to better visualize the whole embryo, scale bar = 40μm. (d) pTyr ratio comparing AV to PV membranes, n=25 for cdc42, n=29 for WaspΔVCA, n=28 for Q61L and n=33 for Q61L+WaspΔVCA, asterisks indicates a significant difference (p<0.005) in the AV vs. PV measurements for that sample set. (e) Quantitative data for induction assays showing % of transgenic embryos with expanded induction, n=374 for Q61L, n=266 for Q61L+WaspΔVCA, n=178 for Q61L+Wasp and n=307 for Q61L+ParCRIB; QL vs. QL+Wasp, p = 0.53, QL vs. QL+Par6CRIB, p = 0.81. (f) Four step model for differential specification of the heart progenitor lineage. 1. Ungraded exposure to growth factor leads to uniform receptor occupancy. 2. Receptor activation is enriched along the ventral membrane in association with enhanced protrusive activity. 3. As founder cells enter mitosis, localized invasive protrusions facilitate restriction of receptor activation to the ventral/anterior membrane. 4. Following division, Map Kinase pathway activation (nuclear dp-ERK) is restricted to the ventral daughter leading to differential expression of heart progenitor genes. See Supplemental Discussion for a more thorough explication of this model.

