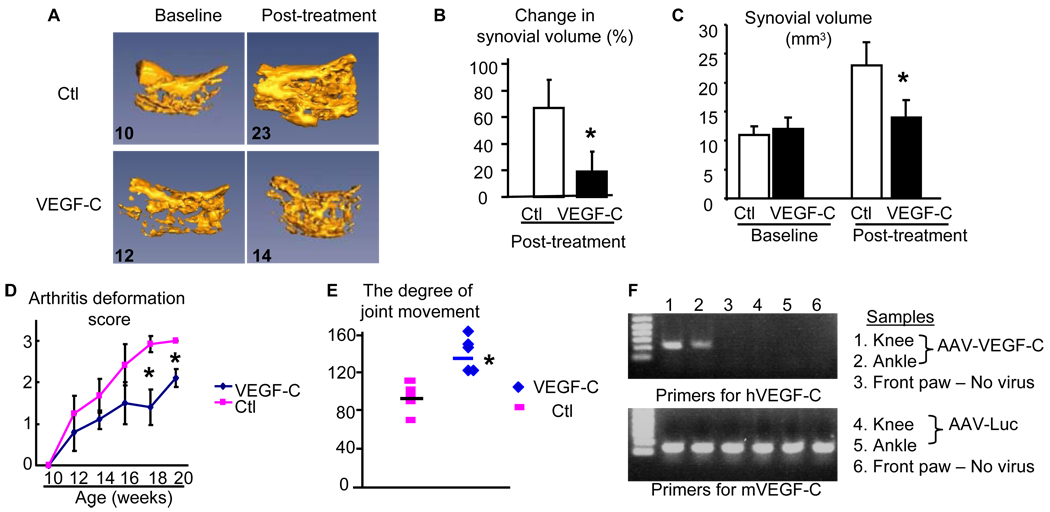
Figure 3. AAV-VEGF-C virus decreases joint inflammation and tissue damage in TNF-Tg mice.
Seven week-old TNF-Tg mice received intra-ankle injection of AAV-Luc control virus (N=3 mice and a total of 6 legs) or AAV-VEGF-C virus (N=4 mice and a total of 5 legs). CE-MRI scans were performed before, 2, and 4 months after viral injection. (A) Representative 3D MRI images at baseline and 4 months show changes in synovial volume. The numbers are the absolute synovial values (mm3) from the image. (B) Percentage changes of synovial volume at 2 and 4 months compared to baseline values in the same joints was derived from MRI images. (C) The absolute synovial values at the baseline and 4 months after viral injection. (D) The arthritis deformation score during the course of treatment. (E) The degree of joint flexibility at the end of treatment. Values are the mean ± SD of 5–6 legs per group. *p<0.05 vs control virus. (F) Expression of virus encoded human VEGF-C in joints of TNF-Tg mice 4 months after viral injection.

