
Figure 4.
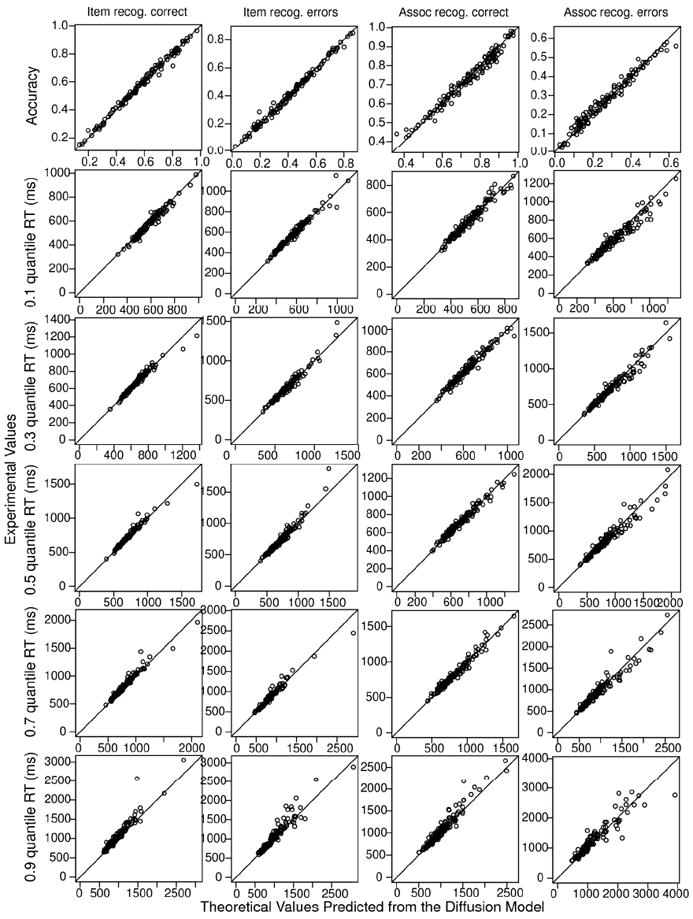
Plots of accuracy and the .1, .3, .5 (median), .7, and .9 RT quantiles for data (y- axis) and predicted values from fits of the diffusion model (x-axis) for correct and error responses for a single condition for item recognition and a single condition for associative recognition for all participants in the three age groups. For item recognition, the data are for high frequency words presented twice, and for associative recognition, the data are for high frequency, intact pairs.