
Figure 5.
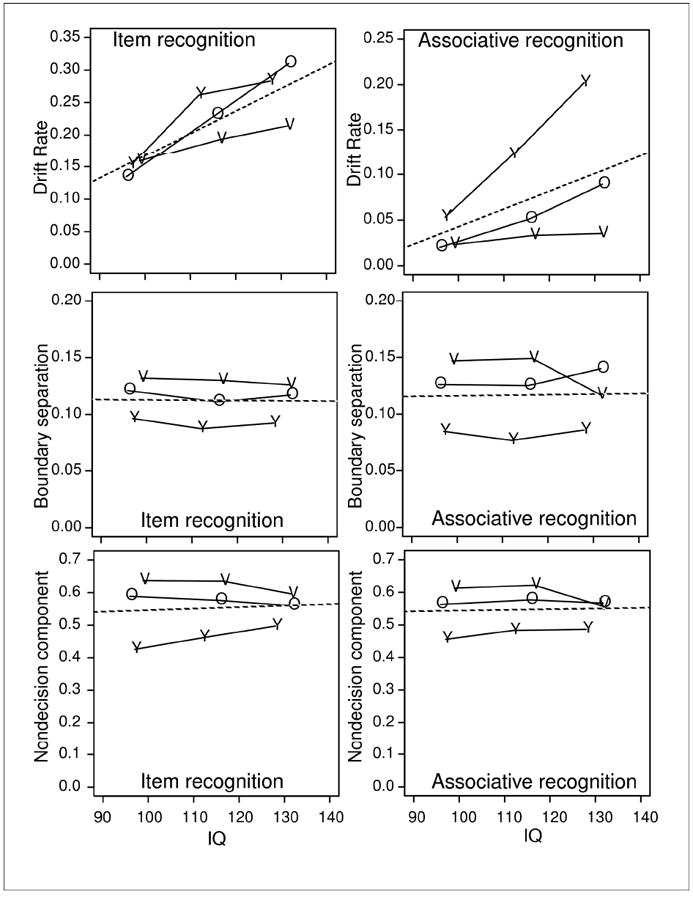
Values of drift rate, boundary separation, and the nondecision component as a function of IQ and age. Y refers to college-age participants, O refers to 60-74 year old participants, and V refers to 75-90 year old participants. The dotted lines are the averages over the three groups of participants.