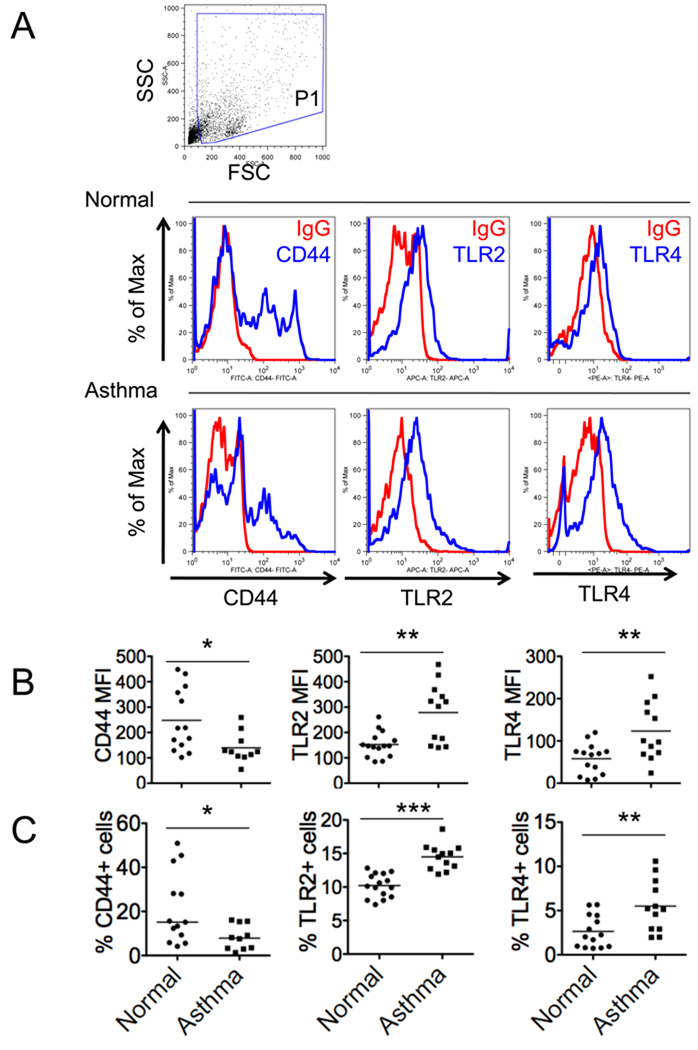
FIG 5.
Flow cytometric analysis of cell surface HA binding protein expression on alveolar macrophages from BAL of asthmatic and normal subjects. A, Live macrophage population (P1) was gated based on forward (FSC) and side scatters (SSC). Overlay of histograms of macrophages stained with specific antibodies to either CD44, TLR2, or TLR4 (blue lines) and respective control IgG (red lines) were shown. The mean fluorescence intensity (MFI) (B) and the percentages (C) of CD44, TLR2, and TLR4 staining positive cells were calculated by comparing to control IgG (CD44, n = 10/13; TLR2, n = 12/15; TLR4, n = 12/14; p < *0.05, **p < 0.01, ***p < 0.0001).

