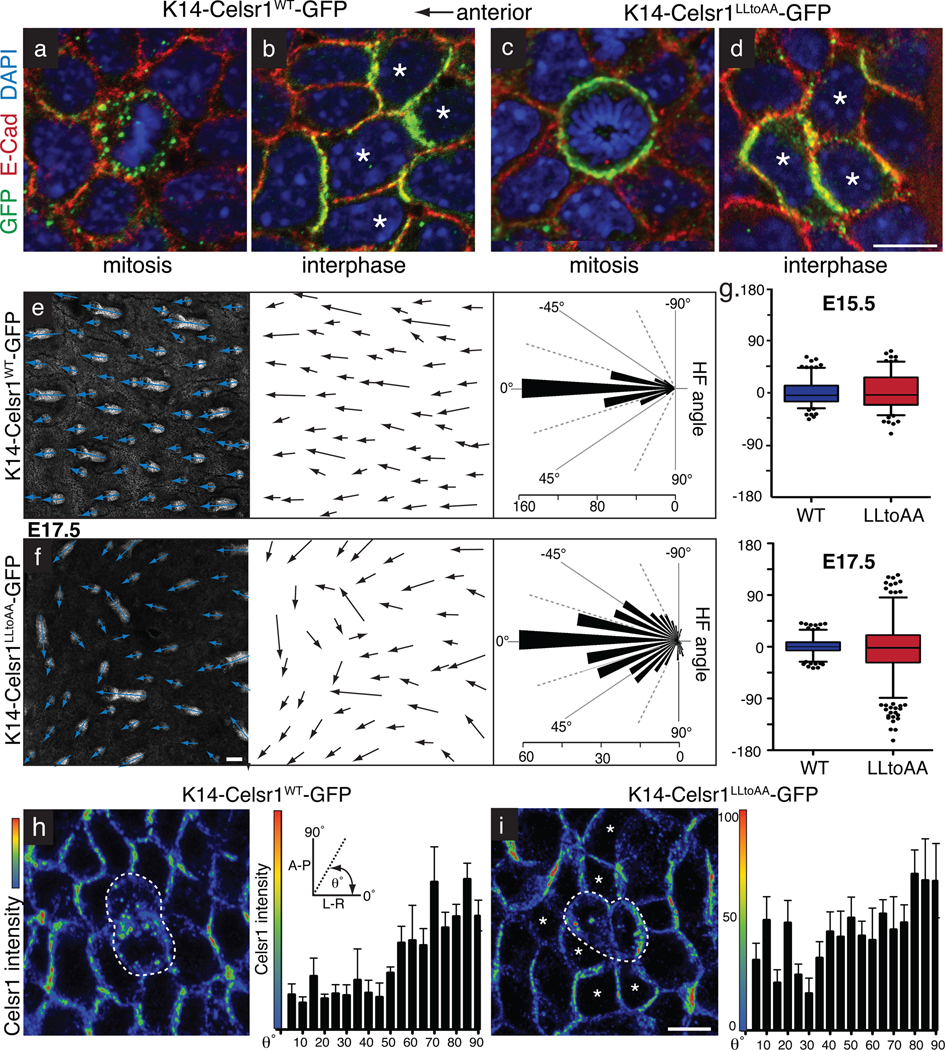
Fig. 6. Mitotic endocytosis of PCP components in basal stem cells is essential for PCP-mediated hair follicle orientation in the skin.
Transgenic founder embryos mosaically expressing WT or LLtoAA-mutant Celsr1-GFP (green) in the skin epidermis. Planar confocal sections through the basal layer of E17.5 whole mount backskins stained with GFP and E-Cad antibodies and DAPI. Anterior is to the left. (a) WT Celsr1-GFP displaying internalization in a mitotic basal cell. (b) WT Celsr1-GFP during interphase is asymmetric localized to the anterior-posterior sides of the plasma membrane. (c) LLtoAA mutant Celsr1-GFP remaining at the plasma membrane of a basal cell undergoing mitosis. (d) LLtoAA Celsr1-GFP mutant is asymmetrically localized in basal cells in interphase. Bar=10µm. (e–f) Representative example of hair follicles from E17.5 K14-Celsr1WT-GFP (e) and K14Celsr1LLtoAA-GFP (f) transgenic founders. Shown are planar confocal sections through hair follicles labelled with E-Cad antibodies. Arrows show the direction of follicle growth. Bars= 50µm. Quantifications of hair follicle angles from transgenic embryos are shown to the right of their corresponding image (WT: n=396 hair follicles, 3 embryos; LLtoAA: n=386 hair follicles, 3 embryos). (g) Quantification of HF angles observed in K14-Celsr1-GFP transgenics at E15.5 (n=179 WT HFs, n=146 LLtoAA HFs) versus E17.5 (n=396 WT HFs, n=386 LLtoAA HFs). (h–i) Altered polarity surrounding mitotic cells expressing internalization defective Celsr1. Images show fluorescence intensity profiles of Celsr1 in planar confocal sections through basal layer of WT and LLtoAA transgenic backskins (red=high, blue=low). Centre cells are in cytokinesis while surrounding neighbours are in interphase. Quantification of Celsr1 intensity at the cell borders of interphase cells directly surrounding mitotic cells is shown to the right, where the average Celsr1 intensity along a border is plotted against its angle. Levels of Celsr1 were normalized to the minimum (0%) and maximum (100%) border intensities for each image field. Borders were binned into 5 degree increments and error bars denote s.e.m within bins. (h) In K14-Celsr1WT-GFP transgenics, A-P borders show highest Celsr1 intensity (n=88 borders). (i) The direction of highest Celsr1 intensity is more randomized in cells neighbouring Celsr1-LLtoAA expressing cells (asterisks; n=219 borders). Bar=10µm.

