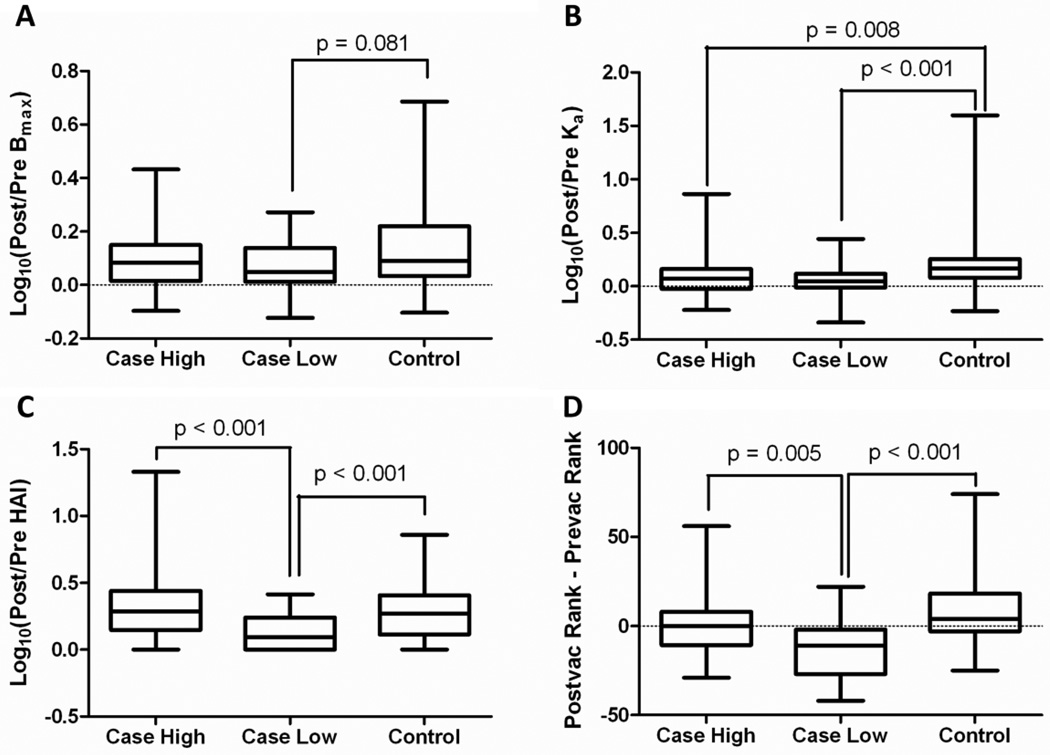
Figure 1. SLE patients with poor antibody responses have reduced humoral immunity compared to healthy controls following influenza vaccination.
Plasma from SLE patients (case) and normal healthy controls (control) were tested for humoral immune responses to the influenza vaccine. Cases were divided into high and low responders based upon cumulative rank as outlined in the methods section of the manuscript. Shown are the log10 transformed ratios of post-vaccination to pre-vaccination measurements for (A) antibody concentration (Bmax), (B) antibody affinity (Ka), and (C) hemagglutination inhibition (HAI). Panel D shows the overall vaccine response, expressed as the difference of the percentile ranks (postvacc minus prevacc). Shown are box and whisker plots where the middle line is the median, the box represents the middle 50% of the data, and the whiskers extend to the minimum and maximum values. P-values are derived from nonparametric Mann-Whitney tests using a Bonferroni multiple comparison correction.

