
Figure 2.
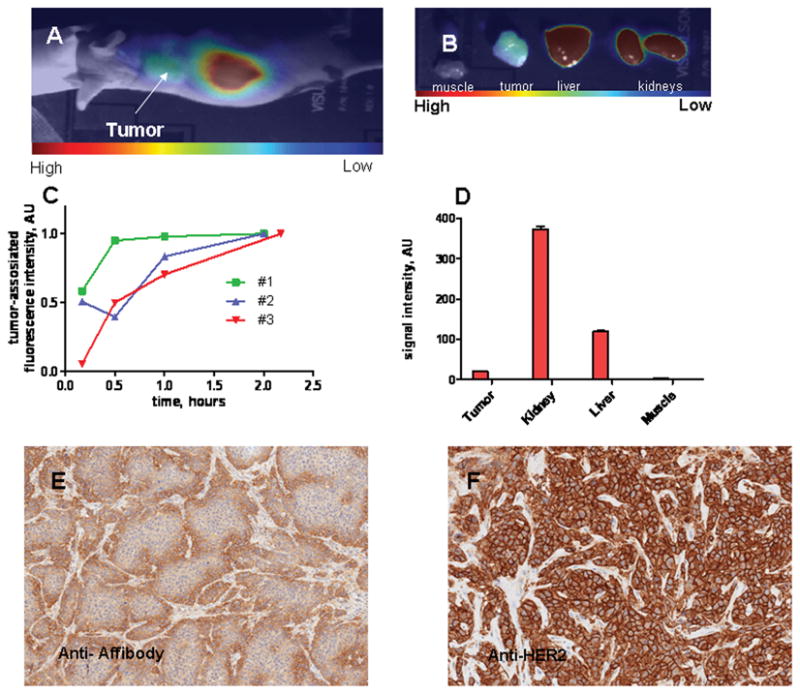
Near-infrared imaging of a BT-474 xenograft-bearing mouse injected with DyLight™750-labeled HER2-Affitoxin.
Three mice bearing BT-474 subcutaneous xenografts received 5 mg/kg of HER2-Affitoxin by tail vein injection, followed by imaging performed 10, 30, 60, and ~120 minutes post-injection. For the same time points, tumor and contra-lateral sites were scanned, as described in the Material and Methods section. A, A representative CCD camera image of mice 2 hours post-HER2-Affitoxin injection. B, CCD camera image of organs 2 hours post-HER2-Affitoxin injection. C, Quantification of tumor-associated fluorescence. The tumor-originated signal, after background subtraction (the signal from the contra-lateral site), was normalized to the maximum uptake observed at the final measurement. D, An example of a fluorescence biodistribution pattern derived from ex vivo scanned organs. Tumors extracted 2 hours post-injection were immunostained using anti-Affibody antibody (Abcam, Cambridge, MA) for HER2-Affitoxin detection (E) and Herceptest™ (Dako, Carpinteria, CA) for HER2 staining (F).