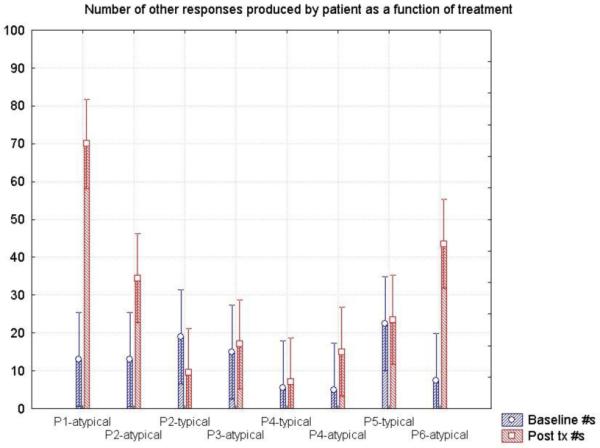
Figure 7.

Proportion of responses produced tabulated as “other” that were not target atypical or typical examples. Blue bars indicate the averaged responses generated during initial two probes and red bars indicate the average responses generated in the final two treatment probes.
