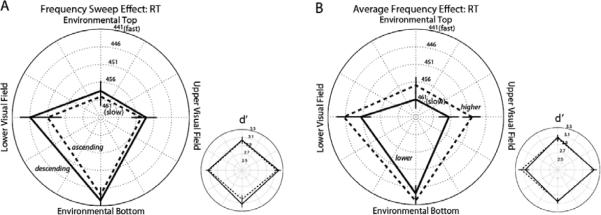
Figure 4.
Mean response times (RT; large plots) for correct “Go” trials and sensitivity values (d'; small plots) in Experiment Four; faster RTs and greater sensitivity values are plotted toward the outer ring of the polar plots. Note that in this experiment, the retinotopic vertical and environmental vertical were orthogonal. Error bars represent ± 1 SEM adjusted for the within-participant design. (A) Frequency-modulation effect (collapsed across frequency). Dashed lines connect mean values for trials with ascending-frequency sounds; solid lines connect mean values for trials with descending-frequency sounds. (B) Frequency effect (collapsed across frequency-modulation direction). Dashed lines connect mean values for trials with higher-frequency sounds; solid lines connect mean values for trials with lower-frequency sounds.

