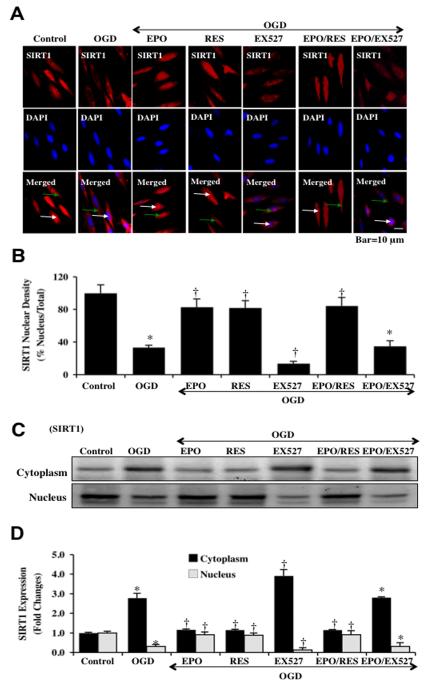
Fig. (2). EPO preserves SIRT1 nuclear shuttling in ECs during OGD.
(A) ECs were imaged at 6 hours after OGD with immunofluorescent staining for SIRT1 (Texas-red streptavidin). Nuclei of ECs were counterstained with DAPI. In merged images, untreated control ECs do not have visible nuclei (red in color, white arrows) that illustrate nuclear localization of SIRT1. However, merged images after OGD show ECs with distinctly blue nuclei and red cytoplasm (green arrows) illustrating that SIRT1 is confined to the cytoplasm. In addition, inhibition of SIRT1 catalytic activity with EX527 (2 μM) also confined SIRT1 to the cytoplasm to a greater degree than OGD alone. Yet, EPO (10 ng/ml), resveratrol (RES 15 μM) or EPO/RES during OGD maintained SIRT1 in the nucleus of ECs (*P<0.01 vs. untreated ECs = Control; †P <0.01 vs. OGD). (B) Quantification of the intensity of SIRT1 nuclear staining was performed using the public domain NIH Image program (http://rsb.info.nih.gov/nih-image). Each data point represents the mean and SEM from 6 experiments. (C) Equal amounts of cytoplasmic or nuclear protein extracts (50 μg/lane) were immunoblotted with anti-SIRT1 at 6 hours after OGD. SIRT1 expression is confined to the cytoplasm after OGD, but EPO (10 ng/ml), resveratrol (RES 15 μM), or EPO/RES application leads to the translocation of endogenous SIRT1 from the cytoplasm to the nucleus. SIRT1 inhibitor EX527 (2 μM) prevents the translocation of SIRT1 to the nucleus to a greater level than OGD alone. (D) Quantification of band density of SIRT1 was performed using the public domain NIH Image program (http://rsb.info.nih.gov/nih-image). (*P<0.01 vs. untreated ECs = Control; †P <0.01 vs. OGD). Each data point represents the mean and SEM from 6 experiments.

