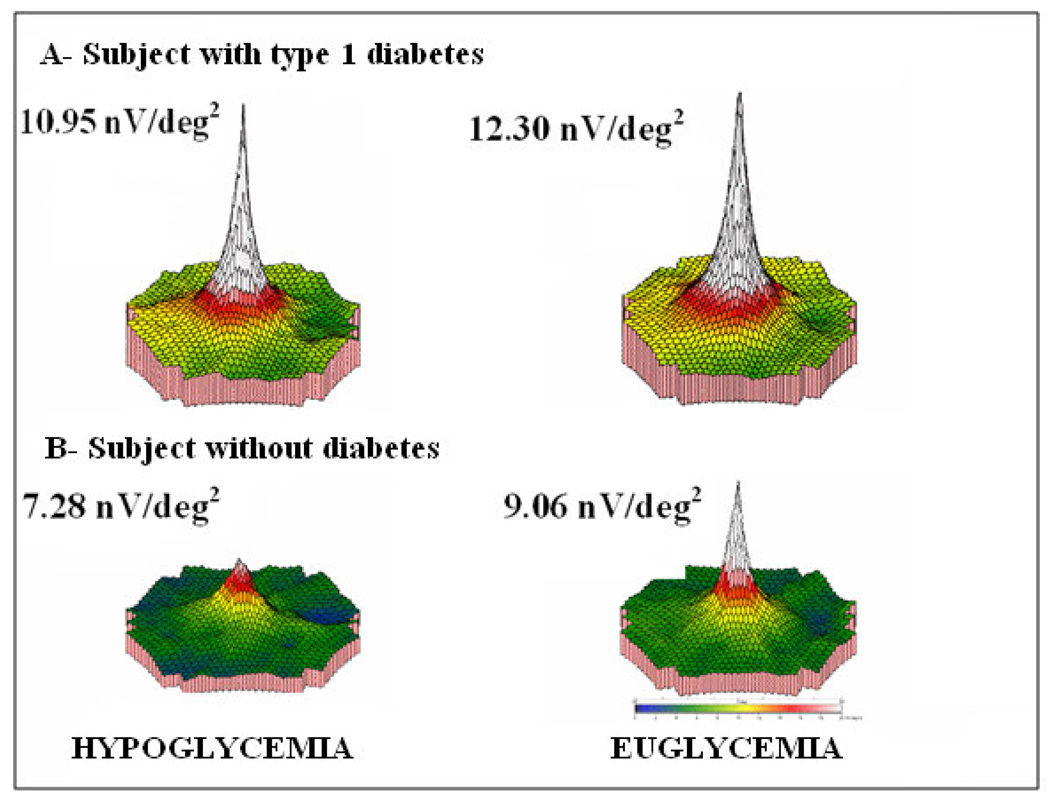
Figure 1.
3-Dimenstional response in: A) subject with type 1 diabetes mellitus and B) normal volunteer. During hypoglycemia and euglycemia the blood glucose levels were 50 mg/dl and 97 mg/dl respectively. The 3 dimensional response density plots showed a significant decrease in amplitude during hypoglycemia in the subject with type 1 diabetes and in the normal volunteer.
nV/deg2 = nanovolts per degrees squared.

