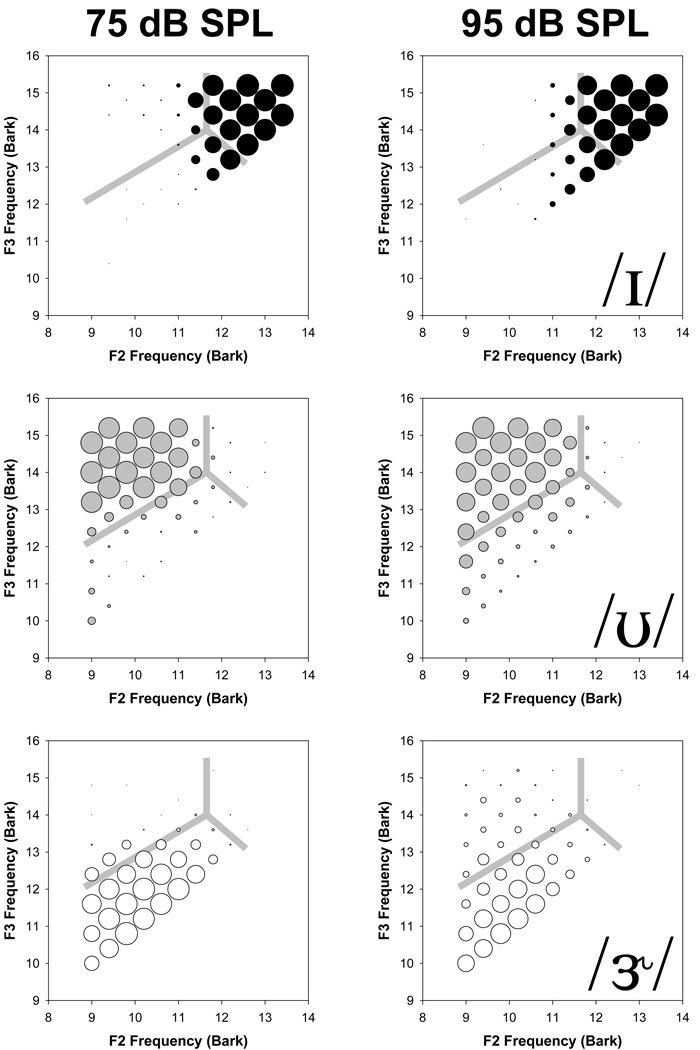
Figure 2.
Bubble plots of pooled vowel identification for the five NH listeners. Bubble size corresponds to the total number of times a stimulus was identified as a member of that category. Each vowel category (top to bottom: / ɪ /, / ʊ /, / ɝ /) for each presentation level (left: 75 dB SPL; right: 95 dB SPL) is displayed on a separate panel. Light gray lines show average linear category boundaries calculated from data for twelve normal-hearing listeners in an earlier study (Maddox et al., 2002).

