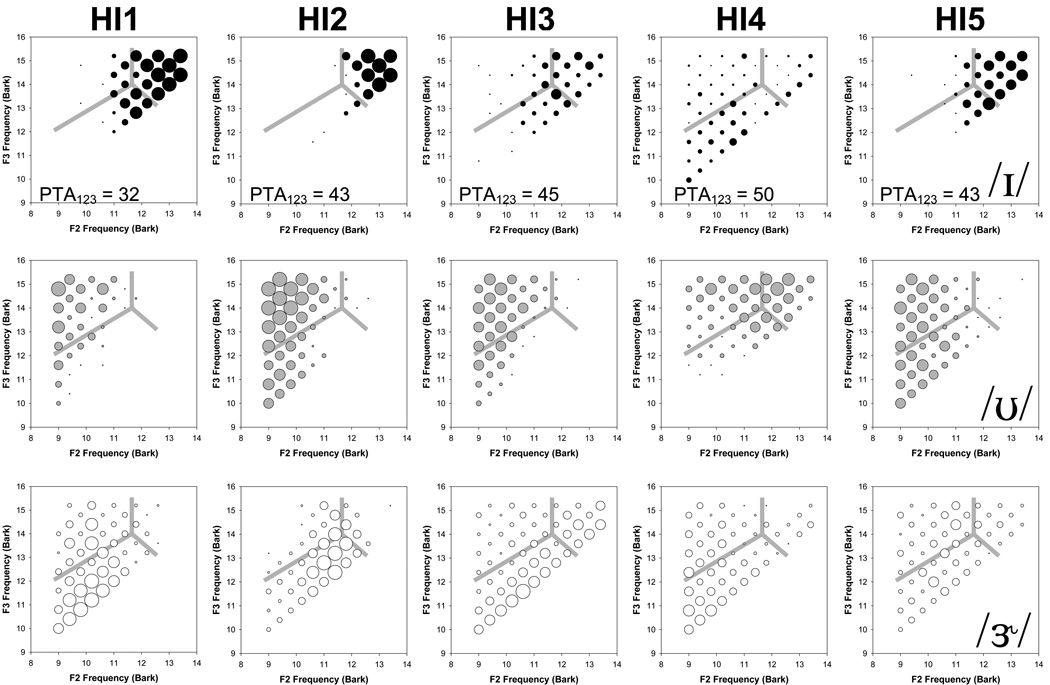
Figure 3.
Bubble plots of individual vowel identification for the five HI listeners. Each vowel category (top to bottom: / ɪ /, / ʊ /, / ɝ /) for each HI listener is displayed on a separate panel. Light gray lines indicate average NH category boundaries as in Fig 2. The pure tone threshold average of 1, 2, and 3 kHz (PTA123) is also indicated.

