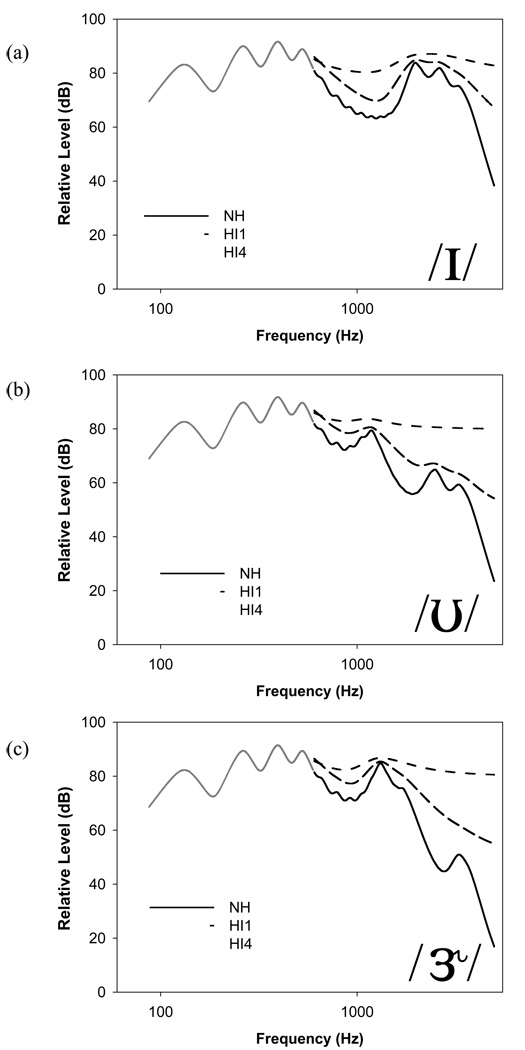
Figure 7.
Excitation patterns for frequencies between 600 and 5000 Hz for the three target stimuli based on the auditory filter bandwidth estimates for HI1 (dashed black line) and HI4 (dashed-dotted black line), and for normal-hearing listeners (solid black line) using auditory filter bandwidth estimates reported by Glasberg and Moore (1990). The solid gray line, which shows the NH excitation pattern for frequencies below 600 Hz, is included as a reference.

