
Fig. 5.
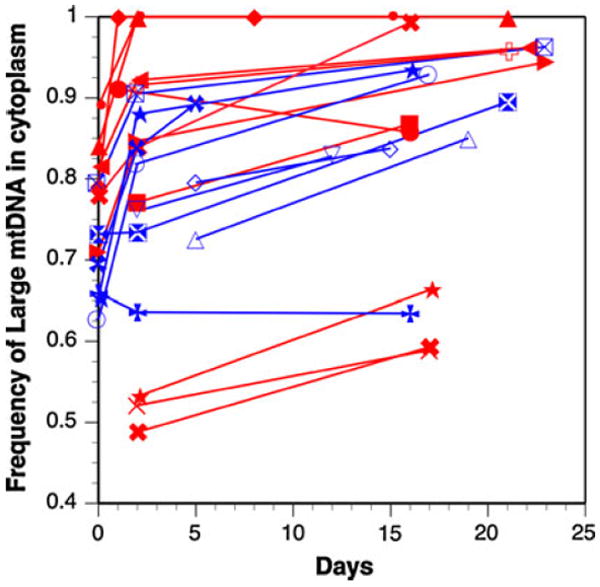
Increase of L mtDNA in transmission from mother to offspring. Day zero is the frequency of L mtDNA in heteroplasmic mothers, and subsequent days are the frequencies of L mtDNA in early or late brood offspring from those mothers. Not all families had data from mothers, so some lines start after day 0. Red lines are 25°C and blue lines are 18°C cultures. There is no significant effect of temperature on frequency shifts (t = 0.46, df = 10, P = 0.65). (Color figure online)