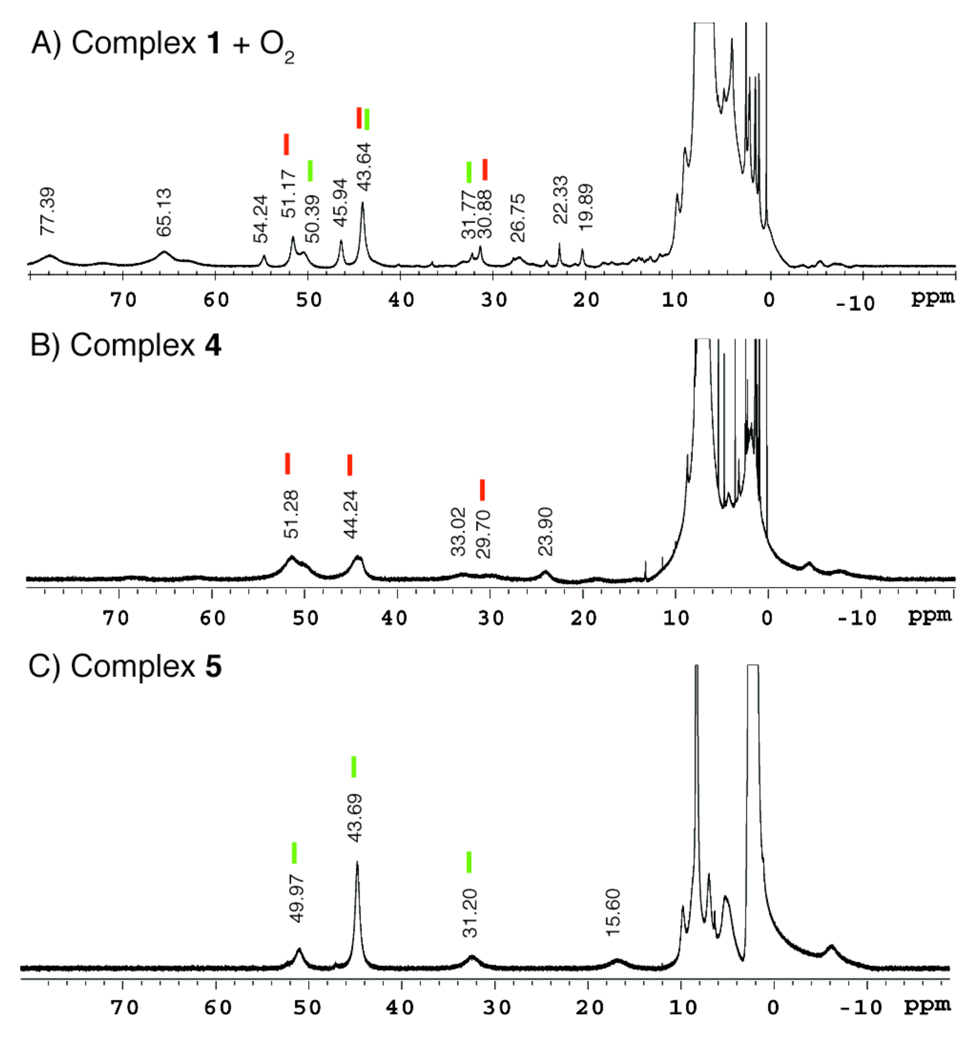
Figure 10.
1H NMR spectra (500 MHz) of A) [Fe2(PIM)(Ph3CCO2)2] (1) + O2; B) [Fe2(μ-OH)(PIM)(Ph3CCO2)3] (4); and C) [Fe4(μ-OH)6(PIM)(Ph3CCO2)2] (5). Comparison of spectrum A to that of B and C reveals that reaction of 1 with O2 leads to formation of 4 and 5, in addition to at least one other product. The peaks that most likely arise from 4 and 5 in spectrum A are marked with red and green lines, respectively. Not all of the peaks in A corresponding to 4 and 5 were assigned because of uncertainty due to the broadness and overlap of some resonances. All spectra were recorded at room temperature with diiron complex concentrations of ~5–10 mM in CDCl3. Relative peak heights are not normalized between spectra.

