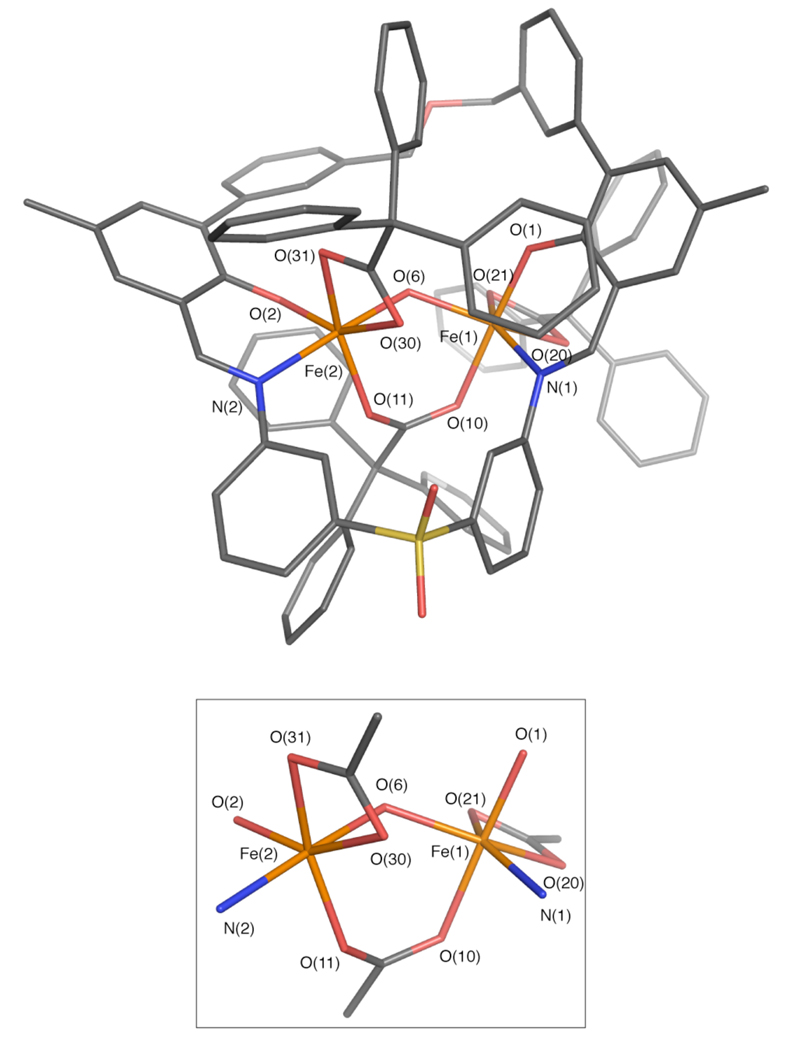
Figure 11.
Stick figure representation of the X-ray crystal structure of [Fe2(μ-OH)(PIM)(Ph3CCO2)3] (4, top). An isolated view of the diiron core is shown in the diagram below. Solvent molecules and hydrogen atoms are omitted for clarity. Color scheme: iron, orange; carbon, gray; nitrogen, blue; oxygen, red; sulfur, yellow. Selected bond distances (Å) and angles (Deg): Fe(1)–Fe(2) = 3.4873(5); Fe(1)–O(1) = 1.890(2); Fe(1)–N(1) = 2.115(2); Fe(1)–O(6) = 1.951(2); Fe(1)–O(10) = 2.064(2); Fe(1)–O(20) = 2.075(2); Fe(1)–O(21) = 2.133(2); Fe(2)–O(2) = 1.872(2); Fe(2)–N(2) = 2.136(2); Fe(2)–O(6) = 1.968(2); Fe(2)–O(11) = 1.980(2); Fe(2)–O(30) = 2.141(2); Fe(2)–O(31) = 2.094(2); O(1)–Fe(1)–N(1) = 87.42(7); O(2)– Fe(2)–N(2) = 87.47(7); Fe(1)–O(6)–Fe(2) = 125.69(9); O(6)–Fe(1)–O(10) = 88.28(7); O(6)– Fe(2)–O(11) = 88.89(7). A thermal ellipsoid ortep diagram of 4 is provided in Figure S16.

