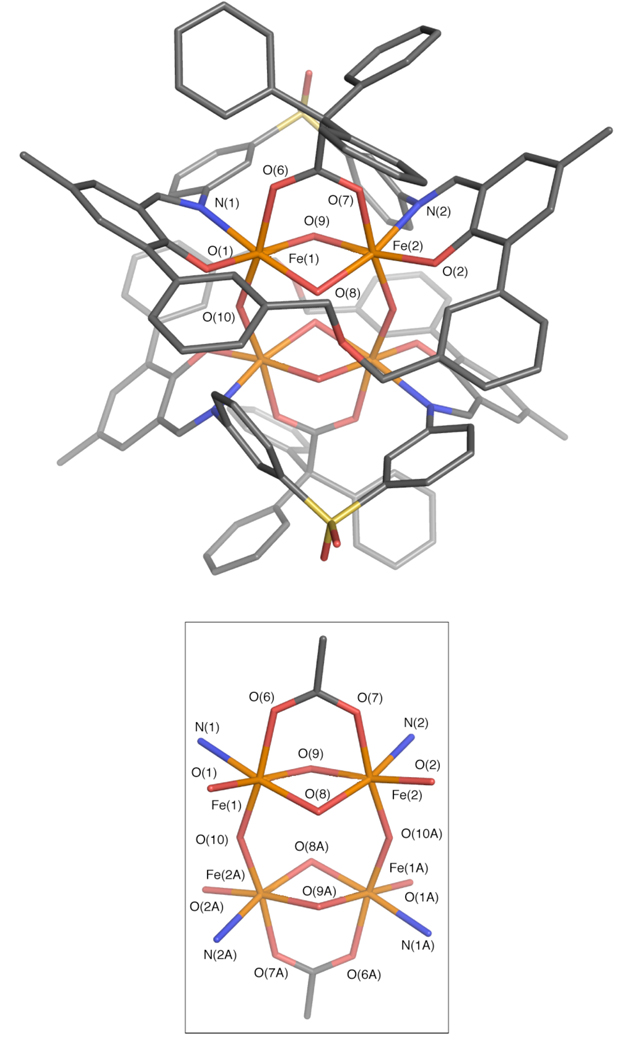
Figure 12.
Stick figure representation of the X-ray crystal structure of [Fe4(μ-OH)6(PIM)(Ph3CCO2)2] (5, top). The center of the complex is located on a crystallographic inversion center. An isolated view of the tetrairon core is depicted in the diagram below. Solvent molecules and hydrogen atoms are omitted for clarity. Color scheme: iron, orange; carbon, gray; nitrogen, blue; oxygen, red; sulfur, yellow. Selected bond distances (Å) and angles (Deg): Fe(1)– Fe(2) = 3.0560(5); Fe(1)–Fe(2A) = 3.780 (standard deviation not calculated); Fe(1)–O(1) = 1.912(2); Fe(1)–N(1) = 2.172(2); Fe(1)–O(6) = 2.042(2); Fe(1)–O(8) = 2.030(2); Fe(1)–O(9) = 1.998(2); Fe(1)–O(10) = 1.978(2); Fe(2)–O(2) = 1.910(2); Fe(2)–N(2) = 2.229(2); Fe(2)–O(7) = 2.073(2); Fe(2)–O(8) = 2.029(2); Fe(2)–O(9) = 2.011(2); N(1)–Fe(1)–O(1) = 83.38(8); N(2)– Fe(2)–O(2) = 85.42(8); Fe(1)–O(8)–Fe(2) = 97.70(9); Fe(1)–O(9)–Fe(2) = 99.35(9); Fe(1)– O(10)–Fe(1A) = 146.5(1). A thermal ellipsoid oretp diagram of 5 is provided in Figure S17.

