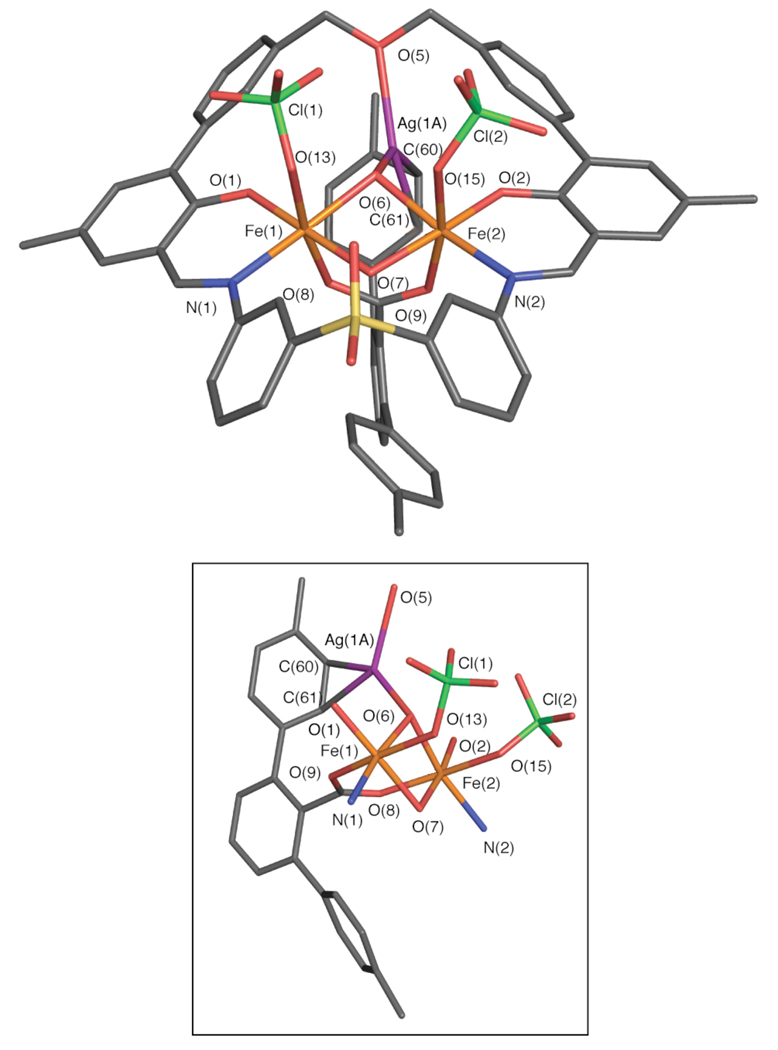
Figure 8.
Stick figure representation of the X-ray crystal structure of [Fe2(μ-OH)2(ClO4)2(PIM)(ArTol CO2)Ag] (3, top). An isolated view of the heterometallic core is shown in the diagram below. The silver ion is disordered over two positions, the major component (Ag(1A), ~91% occupancy) is depicted. Solvent molecules and hydrogen atoms are omitted for clarity. Color scheme: iron, orange; carbon, gray; nitrogen, blue; oxygen, red; sulfur, yellow; green, chlorine; purple, silver. Selected bond distances (Å) and angles (Deg): Fe(1)–Fe(2) = 3.0119(8); Fe(1)–O(1) = 1.847(3); Fe(1)–N(1) = 2.119(4); Fe(1)–O(6) = 2.048(3); Fe(1)–O(7) = 1.996(3); Fe(1)–O(8) = 2.030(3); Fe(1)–O(13) = 2.124(3); Fe(2)–O(2) = 1.866(3); Fe(2)–N(2) = 2.128(4); Fe(2)–O(6) = 2.043(3); Fe(2)–O(7) = 1.974(3); Fe(2)–O(9) = 2.048(3); Fe(2)–O(15) = 2.136(3); Ag(1A)–O(6) = 2.260(3); Ag(1A)–O(5) = 2.414(3); Ag(1A)–C(60) = 2.349(5); Ag(1A)–C(61) = 2.596(5); O(1)–Fe(1)–N(1) = 88.5(1); O(2)–Fe(2)–N(2) = 88.8(1); Fe(1)–O(6)– Fe(2) = 94.8(1); Fe(1)–O(7)–Fe(2) = 98.6(1); O(5)–Ag(1A)–O(6) = 109.5(1); O(5)–Ag(1A)– C(60) = 100.4(1); O(6)–Ag(1A)–C(61) = 117.4(1). See Figure S15 for a depiction of Ag(1B): Ag(1B)–O(6) = 2.335(6), Ag(1B)–O(5) = 2.404(6), Ag(1B)–C(60) = 2.687(8), O(5)–Ag(1B)– O(6) = 107.3(2), O(6)–Ag(1B)–C(60) = 124.7(3), O(5)–Ag(1B)–C(60) = 91.7(2). A thermal ellipsoid ortep diagram of 3 is provided in Figure S15.

