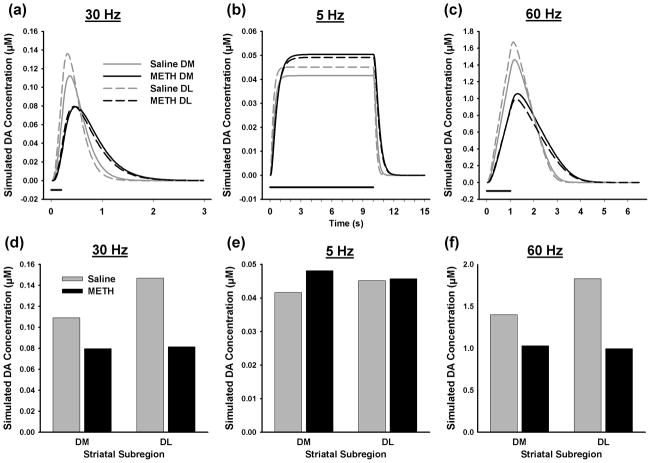
Figure 4.
Simulated tonic- and phasic-like DA responses. Calculations were based on average values for Vmax and [DA]p shown in Figure 3 and assumed a Km of 0.2 μM. Individual curves are shown in (a), (b) and (c), and maximal DA concentrations are shown in (d), (e) and (f) for phasic, tonic and 60-Hz, 60-pulse stimulations, respectively.

