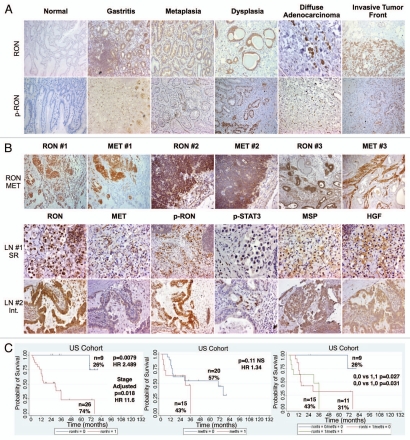
Figure 1.
Expression of MET family receptors and growth factors correlated with histologic progression and overall survival. (A) Representative images showing RON (top) and p-RON (bottom) increasing from minimal to high expression upon progression from normal mucosa to invasive adenocarcinoma. Tumors of both diffuse and intestinal histology are represented. (B) Top row, RON and MET co-expression, shown in three representative samples. Sample #1, (p9, Table 1) demonstrates focal staining of MET compared to RON that occurred in 46% (16/35) of cases. Sample #2 is representative of 37% (13/35) of cases showing diffuse co-staining of both RON and MET. Sample #3 demonstrates MET overexpression in the stromal compartment occurring in 34% of cases (12/35). (B) Bottom rows, representative co-expression of RON, MET, p-RON, p-STAT3, MSP and HGF are demonstrated in two different lymph node (LN) samples, #1 signet ring (SR) and #2 intestinal (Int). LN #1 shows MET and HGF expression in the stromal compartment, while LN #2 reveals MET and HGF expression within the tumor. (C) Clinical correlation of RON (left), MET (middle) or both (right), proteins detected by IHC with overall survival (months) in the American (US) patient cohort, N = 35.

