Figure 2.

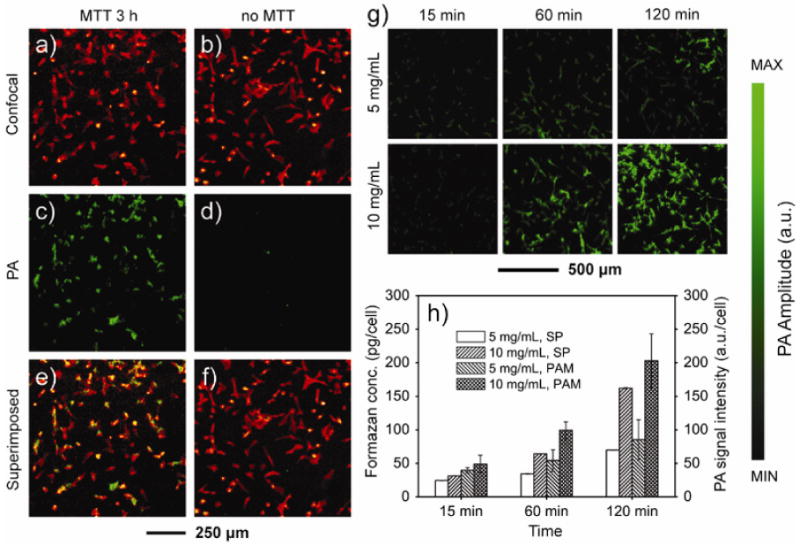
a, b) Confocal microscopy images and c, d) PAM images of fibroblasts cultured on cover glasses. The cells were incubated in the (a, c) presence and (b, d) absence of MTT, respectively, for 3 h, followed by fixation and f-actin staining with Alexa 568-phalloidin. e, f) Superimposed images, indicating that essentially all the cells were stained by MTT formazan. g) PAM images of fibroblasts cultured on cover glasses in the presence of MTT at the indicated concentration and duration of time. The PA signal amplitude increased as the concentration of MTT and the incubation time were increased. h) The amount of MTT formazan and PA signal intensity per cell as a function of MTT concentration and incubation time. After PAM imaging, the MTT formazan in each sample was extracted by dissolution with 1-propanol and then quantified using a spectrophotometer (SP). The MTT formazan concentrations were calculated from the calibration curve (Figure S1) and then divided by the cell numbers (n = 3). The PA signal intensity per cell was calculated from the PA image and cell number (n = 4). Data were presented as means ± standard deviations.
