Figure 3.

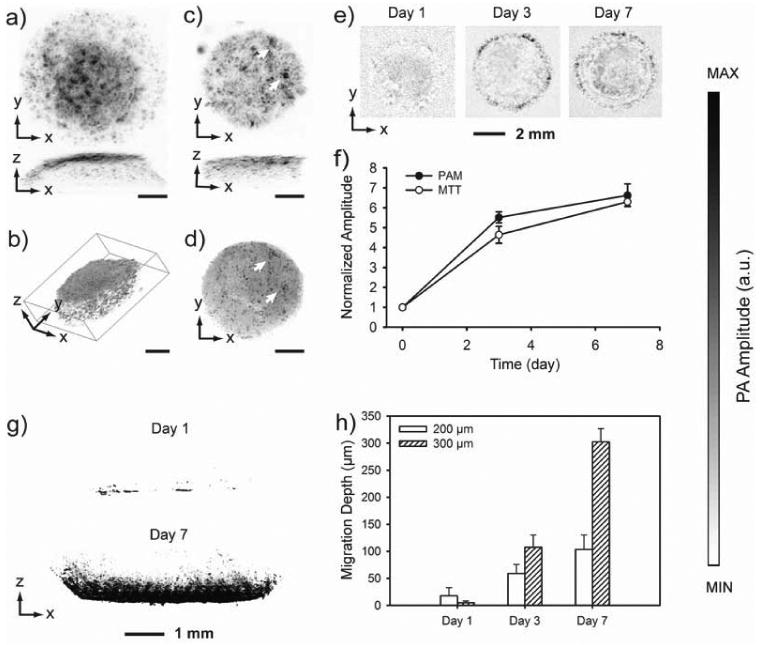
a) PAM MAP image of fibroblasts cultured in an inverse opal scaffold, followed by MTT staining for 3 h; b) 3D rendering of the volumetric PAM data in (a); c) PAM MAP image of fibroblasts cultured in an inverse opal scaffold filled with cross-linked alginate hydrogel, followed by incubation with MTT for 4 h; and d) an optical micrograph showing the same scaffold as in (c). As indicated by arrows, the features in PAM and optical microscopy match well. Scale bars in (a-d): 1 mm. e) PAM chronic images of fibroblasts grown in inverse opal scaffolds (MAPs in the 600-660 μm layers from the top surface) at 6 h, 3 days and 7 days; and f) quantification of cell numbers in the scaffolds as determined by volumetric PAM data and parallel MTT biochemical assays. Data are presented as mean ± standard deviation (n = 3). g) PAM images showing cell invasion profile at day 1 and 7 into inverse opal scaffolds with a pore size of 300 μm; and h) average cell penetration depths in scaffolds with pore sizes of 200 and 300 μm, respectively, as determined by PAM virtual biopsy. Data are presented as means ± standard deviations. MAP, Maximum Amplitude Projection.
