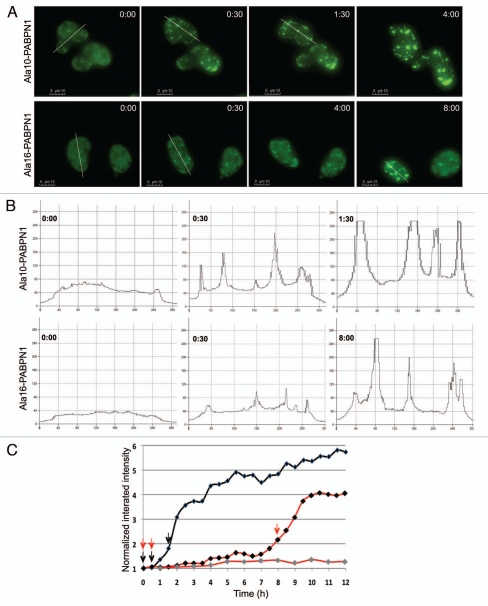
Figure 2.
PABPN1 foci formation is a multi step process. (A) Time-lapse imaging of inclusion formation in cells expressing WT-PABPN1 (Ala10-PABPN1) or expPABPN1 (Ala16-PABPN1) fused to YFP. Time 0 was defined as 1 hour before foci formation. The elapsed time of each frame is indicated. Scale bars are 10 µm. (B) Intensity distribution plots of PABPN1 were made from cells at 0:00, 0:30 and 1:30 and 8:30 hours (in A). Intensities were measured along the transverse lines (shown in A). (C) Quantification of PABPN1 intensity in selected nuclei. Integrated intensity measured in 30–60 min intervals and was normalized to the intensity measured at time 0. Shown are cells expressing YFP-Ala10-PABPN1 (black line) and two YFP-Ala16-PABPN1 expressing cells (red lines). Arrows indicate the times that were selected for generating the intensity plots (B).

