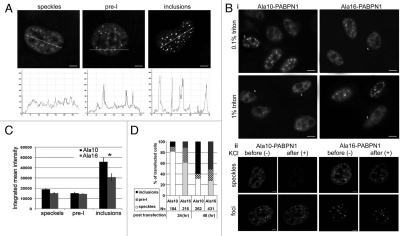
Figure 3.
Quantification of INI formation reveals transitional pre-I structures. Cells expressing YFP-Ala10-PABPN1 (YFP-Ala10) or YFP-Ala16-PABPN1 (YFP-Ala16) vectors and were imaged 24 hours after transfection. (A) Confocal images of representative nuclei show PABPN1 localized to speckles, pre-I and inclusions. Scale bars are 1 µm. Exposure times are equal. For each of the organizational structures intensity distribution plots of PABPN1 were made along the transverse lines. (B) Biochemical properties of pre-I structures. YFP-Ala10-PABPN1 or YFP-Ala16-PABPN1 transfected cells were treated with KCl or Triton-X100 24 hours after transfection. (i) Cells were treated with 1% triton X-100 for 15 minutes, 0.1%% triton X-100 was used as a control. Cells with speckles fluorescence distribution are indicated with S. Scale bars are 10 µm. (ii) Confocal Z-stacks were taken from living cells 20 minutes after KCl (1 M final concentration) treatment. As a control, the same cells were imaged before treatment. Shown are maximum projections of representative cells with speckles or pre-INI. Scale bars are 1 µm. The fluorescence intensity for each of the nuclei is shown. (C) Quantification of integrated fluorescence intensity in cells exhibiting speckles, pre-I or inclusion organization of PABPN1. Confocal images were taken from cells transfected with YFP-Ala10-PABPN1 or with YFP-Ala16-PABPN1 27 hours post transfection, Histograms show the integrated mean intensity of PABPN1 fluorescence in each of the structural organizations: speckles, pre-I and INI. The asterisk indicates p < 0.05, two-tailed t-test. Averages represent 25 cells. (D) Histograms show the percentage of cells with Ala10- or Ala16-PABPN1 with speckles, pre-I or inclusions at 24 and 48 hours after transfection. The number (N=) of counted cells is indicated.

