Figure 4.
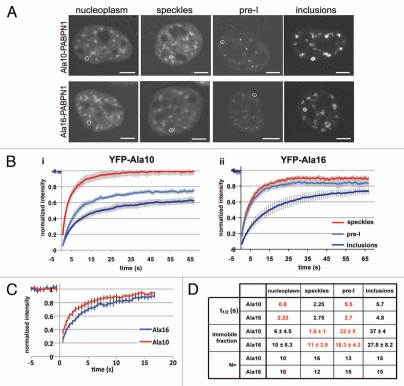
FRAP analysis reveals differences in protein mobility between WT- and expPABPN1. FRAP analysis was preformed on cells transfected with YFP-Ala10-PABPN1 (YFP-Ala10) or YFP-Ala16-PABPN1 (YFP-Ala16) vectors. (A) Confocal images of representative nuclei. The bleached area in nucleoplasm, speckles, pre-I and inclusions are indicated with circles. Scale bars are 1 µm. (B) FRAP plots show the fluorescence recovery of YFP-Ala10-PABPN1 (i) or YFP-Ala16-PABPN1 (ii) in speckles (red line), pre-I (light blue) or inclusions (dark blue). (C) FRAP plots show the fluorescence recovery of YFP-Ala10-PABPN1 (red) or YFP-Ala16-PABPN1 (blue) in the nucleoplasm. (D) Table shows the biophysical properties of PABPN1 in the three nuclear structures and in the nucleoplasm. Differences between YFP-Ala10-PABPN1 and YFP-Ala16-PABPN1 are highlighted in red. N indicates the number of cells used for statistical analysis.

