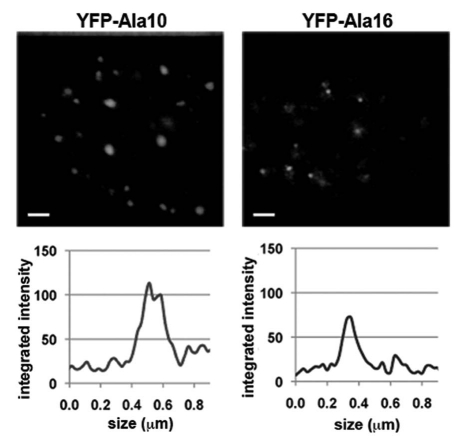
Figure 6.
High-resolution STED microscopy reveals size differences between WT- and expPABPN1 pre-I structures. Cells expressing YFP-Ala10-PABPN1 or YFP-Ala16-PABPN1 were fixed 24 hours post transfection and subjected to STED microscopy. (i) Image shows representative nuclei, scale bar equals 400 nm. (ii) Line profiles and foci size is shown for the smallest individual foci in each of the images.

