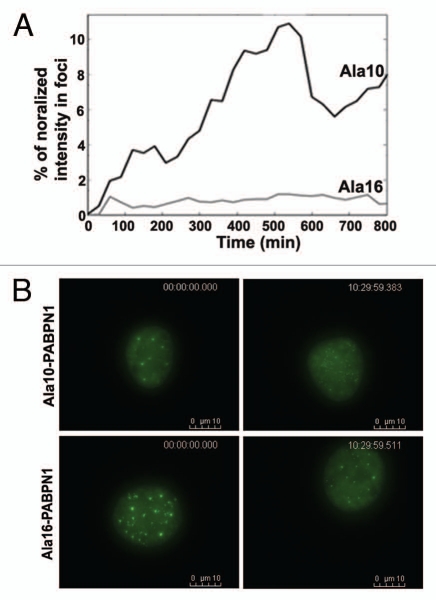
Figure 7.
Temporal differences between WT and expPABPN1 aggregation process. (A) Quantitative analysis of PABPN1 accumulation in foci. The fluorescence intensity in foci was measured from time-lapse images of cells expressing YFP-Ala10-PABPN1 or YFP-Ala16-PABPN1. The percentage of fluorescence intensity localized to foci was calculated from the nuclear fluorescence intensity. Plots show average of 7 and 15 cells for WT- and expPABPN1, respectively. (B) Pre-I reversion. Images of nuclei at time 0:00 and 10:30 hours were taken from time-lapse imaging of cells expressing YFP-Ala10- or Ala16-PABPN1. Time and scale bars are indicated.

