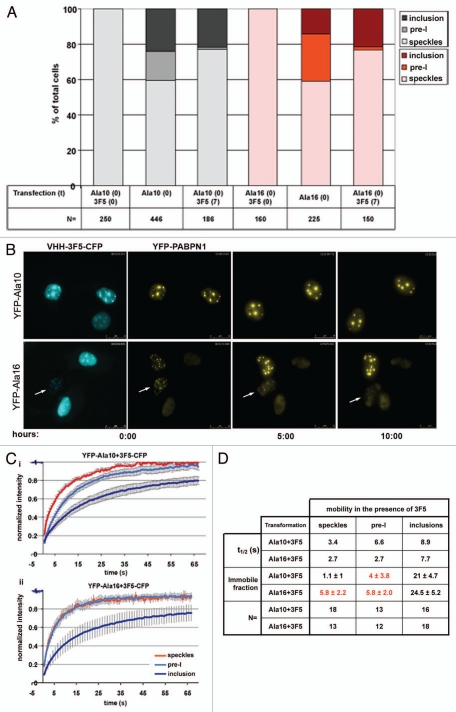
Figure 8.
VHH-3F5 dissolves pre-I structures. (A) Histograms show the percentage of speckle, pre-I or inclusions as function of time in cells co-expressing YFP-Ala10-PABPN1 or YFP-Ala16-PABPN1 and NLS-VHH-3F5-CFP. Cells were either co-transfected with the PABPN1 and VHH-3F5 plasmids at time 0, or initially transfected with the PABPN1 constructs and after 7 hours co-transfected with the VHH-3F5 construct. Measurements were carried out 24 or 32 hours post-transfection, respectively. The number of cells for each histogram is indicated. (B) Time-lapse imaging of cells that were initially transfected with either YFP-Ala10-PABPN1 or YFP-Ala16-PABPN1 and 7 hours later co-transfected with VHH-3F5-CFP. Imaging of living cells started 24 hours after transfection with VHH-3F5-CFP. Upper row shows co-transfected cells with inclusions. VHH-3F5-CFP binding to PABPN1 in inclusions does not affect the aggregates. Lower row show a co-transfected cell with pre-I (indicated with an arrow), where the foci structures gradually disappears. (C) FRAP fluorescence recovery plots of U2OS cells that were sequentially co-transfected cells. FRAP was measured from YFP-Ala10-PABPN1 (i) or YFP-Ala16-PABPN1 (ii) in speckles (red line), pre-I (light blue) and inclusions (dark blue). Averages represent 12–18 cells, as indicated in (D). Table shows the half time of fluorescence recovery (t1/2) in seconds and the immobile fraction for every set of transformations in each of the PABPN1 organizational structures. Numbers that are highlighted in red indicate significant difference between the single transfections, as shown in Figure 3C, and the co-transfections with VHH-3F5. The number of cells used for statistical analysis is indicated (N).

