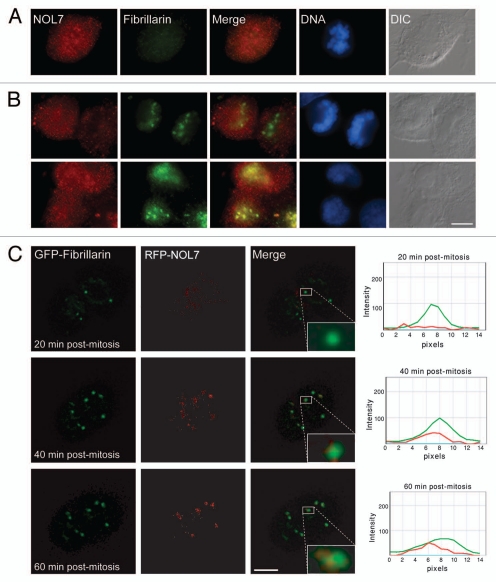
Figure 5.
Subcellular localization of NOL7 during mitosis. (A) Immunofluorescence of endogenous NOL7 and fibrillarin during mitosis and (B) during cell division. (C) Frames from a live-cell movie following RFP-NOL7 (red) and GFP-fibrillarin (green) during the last stages of cell division. A box around one of the forming nucleolar bodies shows the appearance of fibrillarin followed by NOL7. The plots on the right measure the intensity of the two signals at different time points through the center of the box. Bar, 10 µm.

