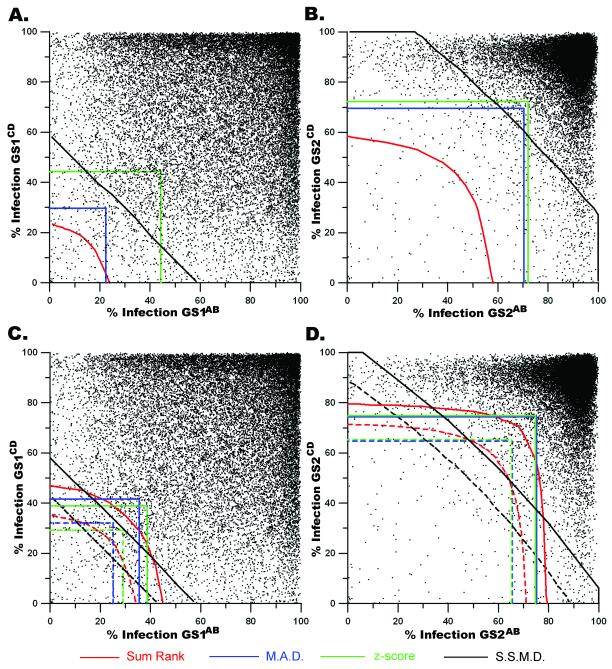
Figure 4. The illustrated thresholds from four statistical methodologies overlaid onto the associated genomic population.
For (a, b, c, d): genomic screen 1 (GS1), genomic screen 2 (GS2), sum rank (SR), median absolute deviation (MAD), z-score, and strictly standardized mean difference (SSMD). a, Each point (▪) represents the % Infection for the analyzed population in GS1AB plotted against the % Infection from the corresponding wells within GS1CD. The illustrated lines indicate the thresholds within which hits are declared if SR ≤ 0.001350, MAD ≤ −2.000, z-score ≤ −3.000 or SSMD ≤ −3.000. b, Similar to a, excepting that the % Infection from GS2AB is plotted against the % Infection for corresponding wells from GS2CD. The thresholds indicate the limits within which hits can be declared assuming SR ≤ 0.001350, MAD ≤ −3.000, z-score ≤ −3.000 or SSMD ≤ −3.000. c, The thresholds for the top 200 (dashed lines) and top 500 (solid lines) lists generated by SR, MAD, z-score and SSMD are overlaid onto the scatter plot of the % Infection (as described in a) for the paired siRNA pools in GS1AB and GS1CD. d, The % Infection for corresponding siRNA pools within GS2 are plotted as coordinates (GS2AB, GS2CD). The limits determining the top 200 (dashed lines) and top 500 (solid lines) lists are illustrated in the context of the GS2 population.

