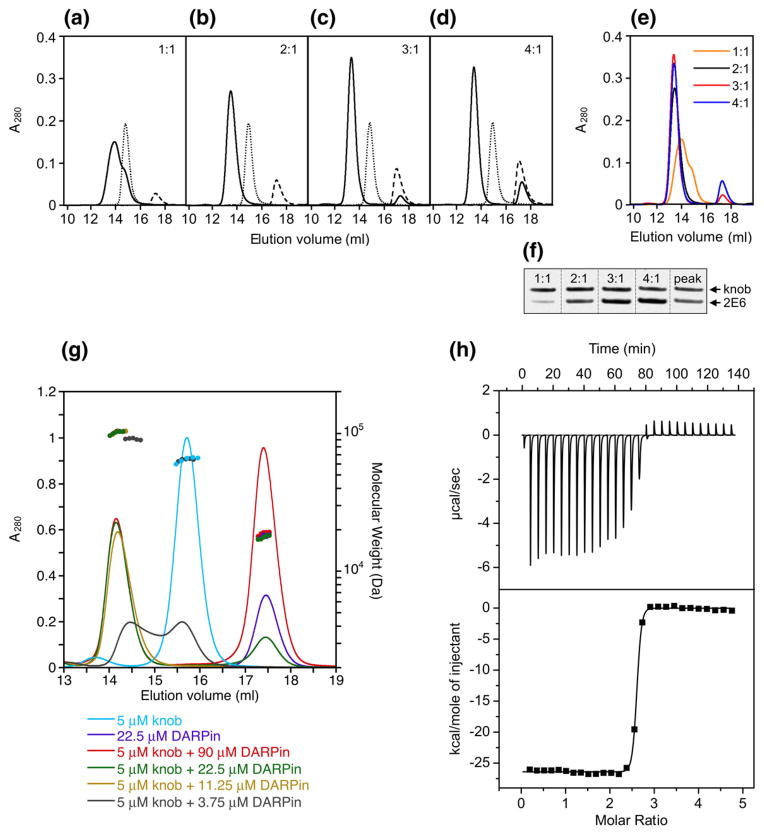
Fig. 4.
Determination of stoichiometry of DARPin binding to the knob by SEC. (a)–(d) Profiles of mixtures of 2E6 DARPin with the knob protein (one, two, three or four DARPin molar equivalents added per trimeric knob) resolved by SEC. Ratios at which the proteins were mixed are shown in the upper right corner of each panel. Profiles of elution for the knob, DARPin and DARPin-knob mixtures are shown by the dotted, broken and unbroken lines, respectively. (e) Overlay of the curves corresponding to the DARPin-knob mixtures (as in (a)–(d)). (f) SDS-PAGE of mixtures of 2E6 with the knob at indicated ratios, which were used to create a calibration curve to measure the ratio of the proteins in the chromatography peak containing the DARPin–knob complexes. (g) SEC-MALS of DARPin–knob mixtures. The knobΔTAYT protein at a concentration of 5 μM was incubated with different concentrations of DARPin 2E6 (3.75, 11.25, 22.5 and 90 μM). Complex formation was analyzed by size-exclusion chromatography coupled to MALS. The curves shown represent the absorption at 280 nm (peaks; left-hand y-axis). The determined mass of the knobΔTAYT trimer, DARPin 2E6 and the complex are given on top of the corresponding protein peaks (right-hand y-axis). (h) ITC of knobΔTAYT protein (34 μM) with DARPin 2E6 (770 μM stock). Top panel, raw instrumental output (differential power as a function of time). Bottom panel, binding isotherm. The heats measured at each titration step were normalized for the molar concentration and corrected for unspecific heats (symbols). The unbroken line is the best fit according to a binding model assuming identical and independent binding sites. The best fitting parameters are: molar enthalpy (ΔH), −26.5±0.9 kcal mol−1; and number of binding sites (n), 2.5±0.2. Note that the concentrations are so far above KD that a reliable determination of KD is not possible.

